|
|

This chapter describes the CiscoWorks fault management features that help you monitor and diagnose network problems. This includes diagnosing individual devices, lines, and interfaces, detecting potential faults, and recovering from problems. This chapter contains the following sections:
Several CiscoWorks applications help monitor and diagnose the SNMP devices in your network. Use the following CiscoWorks applications when performing fault management. A brief description of each application follows.
These applications enhance your capabilities as a network administrator to set up diagnostic procedures when your network develops problems. These applications are discussed in detail in the following sections.
You can use CiscoWorks fault management applications to troubleshoot network problems. describes network problems and recommends CiscoWorks applications to help you troubleshoot and resolve the problem. To use the table, locate the problem description that most closely resembles your current situation. Then perform the recommended tasks until you determine the solution to the problem.
| Problem | CiscoWorks Application Recommendation |
|---|---|
| Possible problem on a network device | Use Device Management to identify the appropriate vendor to contact for assistance. Refer to the section "Vendors Window" in the "Device Management" chapter. |
| Use Device Management to get specific data on a device (serial number, software version, and so on). Check for a mismatched SNMP community string. If the community string in the NMS database does not match the string in the device, you are unable to reach the device. Refer to the section "Adding, Modifying, or Deleting a New Device" in the Device Management chapter, Use Sync w/Sybase to synchronize your devices. Refer to the section "Using Sync w/Sybase" in the "Device Management" chapter. | |
| If you are using Site/SunNet/Domain manager, use Device Monitor to monitor environment and interface statistics. Refer to the section "Monitoring Network Devices (Site/SunNet/Domain manager Platform)," later in this chapter.
If you are using HP OpenView, use HP OpenView's network monitoring application. For more information, refer to the HP OpenView Network Node Manager User's Guide. If you are using NetView for AIX, use NetView's network monitoring application. For more information, refer to the NetView for AIX Administrator's Guide. | |
| Use Path Tool to check the graphical path for link utilization analysis. Refer to the section "Locating Device Routing Paths" later in this chapter. | |
| Use Environment Monitor to check the voltage and temperature of Cisco routers. Refer to the section "Monitoring Device Environment Statistics" later in this chapter. | |
| Use Show Commands to get data on the version, interface, and so on for analysis. Refer to the section "Using Show Commands to View Router Data," later in this chapter. | |
| Use Configuration Management to compare present and previous configurations for errors. Refer to the section "Managing Cisco Device Configuration Files" in the "Managing Cisco Device Configurations" chapter. | |
| Use Contacts data to get information on whom to call in your company. Refer to the section "Using Device Contacts," later in this chapter. | |
| Possible protocol problem | If you are using the Site/SunNet/Domain manager platform, check Device Monitor to ensure that you are monitoring events (and interfaces). Refer to the section "Monitoring Network Devices (Site/SunNet/Domain manager Platform)," later in this chapter.
If you are using HP OpenView, use HP OpenView's network monitoring application. For more information, refer to the HP OpenView Network Node Manager User's Guide. If you are using NetView for AIX, use NetView's network monitoring application. For more information, refer to the NetView for AIX Administrator's Guide. |
| Use Path Tool to determine whether the protocol is routing efficiently (link speed, utilization and error analysis). Refer to the section "Locating Device Routing Paths," later in this chapter. | |
| Use Show Commands to view packet information using Show Traffic Mix command. Refer to the section "Using Show Commands to View Router Data," later in this chapter. | |
| Use Real-Time Graphs to get information on router traffic. Refer to the section "Graphing Your Real-Time Device Data," later in this chapter. | |
| Possible router configuration problems | Use the Show Version command to ensure that version numbers are compatible. Router software must be Software Release 8.2 or later. Refer to the section "Graphing Your Real-Time Device Data," later in this chapter. |
| Log on to the device and determine whether the device configuration file has a read-write community string. Refer to the section "Comparing a Configuration on a Device with the Database Version" in the Managing Cisco Device Configurations chapter. Also see this table's recommendation under the "Suspected problem on a network device" entry. | |
| Verify that the device is running (Show Interface, Show Traffic Mix commands). Refer to the section "Using Show Commands to View Router Data," later in this chapter. | |
| Determine whether a configuration file was downloaded to a device with syntax errors in it. Log on to the outer console and initiate a TFTP session from the router. The errors will be displayed on your console screen. Or log into the router before you download a file. Check to see if any error messages exist. Refer to the section "Loading a Configuration File" in the "Managing Cisco Device Configurations" chapter. |
From the Security menu you can change your user ID if you need special access to the secured CiscoWorks applications using the Change User command. You can also check your security privileges for your current user ID by using the Privileges command.
For more information on the security options in your fault management applications, refer to the "Setting Up Domains and Securing Applications" chapter.

Use the CiscoWorks Device Monitor (nmdevmon) application to monitor interface and environmental card status and to filter event messages. This application provides a summary of the current devices and the categories that are being monitored.
Also use the Device Monitor to set the polling frequency for each device for interface and environment information, or to enable event logging. Because the Device Monitor polls each device according to a set polling frequency, the poll data adds to your network traffic. The default polling frequency rate is 60 seconds. The recommended minimum polling interval depends on the number of devices you are polling and how much network bandwidth you want to devote to network management.
The Device Monitor uses a monitoring engine called the Device Monitor daemon (nmdevmond) to perform the following functions:
Set monitoring requirements in the Device Monitor window; the Device Monitor daemon uses these requirements to perform its monitoring tasks. For more information on the Device Monitor daemon, refer to the "Using CiscoWorks Process Manager" chapter.
Figure 3-1 illustrates the process that CiscoWorks uses when monitoring devices.
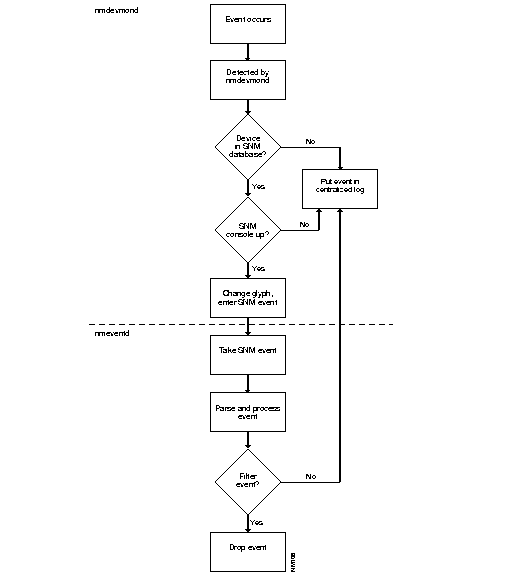
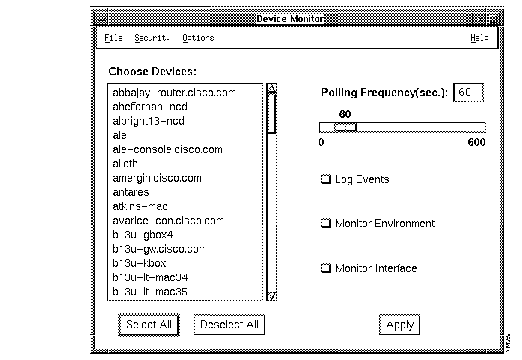
Figure 3-2 illustrates the Device Monitor window. Table 3-2 describes its components.
| Component | Subcomponent | Description |
|---|---|---|
| File | Print
Exit | Opens the screen capture facility of your system.
Closes the current window. |
| Security | Change Domain
Change User Privilege | Enables you to change to another domain, if available.
Enables you to change your user name in order to access this application. |
| Options | Activate Changes
Summary | Updates polling to new values.
Provides an overview of which monitoring options are on or off and what interval is set for polling. |
| Help | On Version
On Device Monitor | Displays the CiscoWorks version information for this application. |
| Devices scroll window | Displays all the Cisco devices found in the Sybase database. | |
| Select All | Selects all devices in the device browser. | |
| Deselect All | Deselects all devices in the device browser. | |
| Polling Frequency | Polling Frequency Slider | Changes the polling rate by clicking on the slider. The default is 60 seconds. |
| Check Boxes | Monitor Environment Monitor | Monitors environmental monitor card data on the Cisco AGS+ router.
|
| Apply | Applies changes to selected devices to the Sybase devices table. |
To set device-monitoring options, perform the following steps:
Step 1 From the main Site/SunNet/Domain manager menu, select Tools>CW - Device Monitor.
The Device Monitor window appears. (See Figure 3-2.)
Step 2 Select the devices you want to change. To set individual device monitoring options, click on the device or devices in the scroll window. To set all devices at once, click on
Select All.
Step 3 Change the default polling frequency by using the Polling Frequency Slider or type over the default in the Polling Frequency field and press Return.
Step 4 Select the categories of options (events, environment, interface) by clicking on the check boxes next to the option you want.
Step 5 Accept monitoring designations by clicking on Apply.
Step 6 Select Options>Activate Changes to send the changes to the Device Monitoring daemon.
After your changes are sent to the Device Monitoring daemon, the Device Monitor begins polling your designated options.
To exit the Device Monitor window, select File>Exit.
The Device Monitor can monitor only devices that exist in the Sybase device table. If a new device has been added to Site/SunNet/Domain manager manually or via the Site/SunNet/Domain manager Discover program, the Device Monitor will not see it until you perform one of the following tasks:
You can quickly view the following device monitor settings with the Device Monitor Summary window:
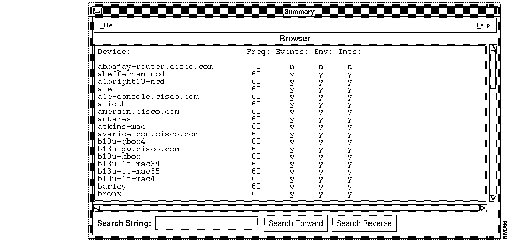
Figure 3-3 illustrates the Device Monitor Summary window. Table 3-3 describes its components.
To view your device monitor settings, perform the following steps:
Step 1 From the Device Monitor window, select Option>Summary.
The Device Monitor Summary window appears. (See Figure 3-3.)
Step 2 Search for a specific device by entering the device name in the Search String field.
Step 3 Click on Search Forward or Search Reverse.
To exit the Device Monitor Summary window, select File>Exit.
The Device Monitor application is not available in CiscoWorks for HP OpenView or CiscoWorks for NetView. To monitor network devices, use the network monitoring capabilities on your HP OpenView/Netview platform. For additional information about network monitoring, refer to the HP OpenView Network Node Manager User's Guide or NetView for AIX Administrator's Guide.

With Software Release 9.0, Cisco has enhanced the environmental monitor card on the AGS+ router and Cisco 7000, by adding several features to allow the monitoring of temperature and voltage sensors via SNMP. Your environmental monitor card must be at minimum a Revision 4 ENVM card (Microcode Version 2.0).
The CiscoWorks Environmental Monitor application enables you to view the environmental monitor status of a current device, including temperature and voltage statistics. The default temperature is displayed in Celsius.
If you are using Site/SunNet/Domain manager and want to display the environmental monitor card version or hardware information from the Glyph Tools menu, select Show Commands.
For more information on the environmental monitor card features for the AGS+, refer to the configuration note "Installing and Configuring the Environmental Monitor Card in the AGS+ Chassis." For information on the environmental monitor card features for the Cisco 7000, refer to the configuration note "Cisco 7000 Microcode Configuration Note."
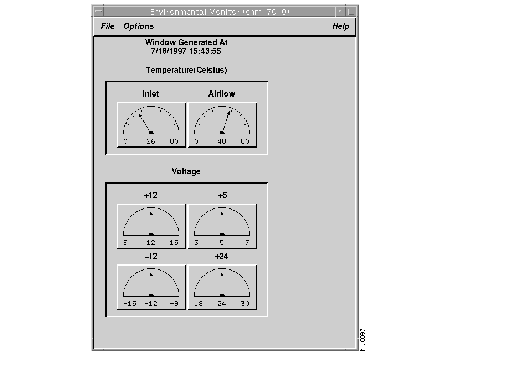
Figure 3-4 illustrates the Environmental Monitor window. Table 3-4 describes its components.
To use the Environmental Monitor to check the temperature and voltage of a device, perform the following steps:
Step 1 Select Environmental Monitor.
On Site/SunNet/Domain manager, click on the device and select Tools>CW - Environmental Monitor from the Glyph menu.
On HP OpenView, select Monitor>CW - Environmental Monitor.
On NetView, select Monitor>CW - Environmental Monitor.
The Environmental Monitor window appears. (See Figure 3-4.)
If the device becomes disconnected, a retry popup window appears until connectivity is restored. The following message appears:
The retry popup window restarts the timer and proceeds when the Cisco device is available. You can retry the request or quit.
Step 2 To change from Celsius to Fahrenheit, select Option>Convert to Fahrenheit.
The window automatically updates and reappears with Fahrenheit temperatures.
Step 3 To change the polling frequency, select Option>Set Polling Frequency.
A Polling Frequency window appears. Use the polling interval slider or type over the default in the Polling Frequency field and press Return.
Step 4 To print the screen, select File>Print.
Depending on the network management platform you use, you may see different print utilities. For more information on these print utilities, refer to the platform documentation.

The Path Tool application graphically displays the routing path between a source device and a destination device using the standard protocols (SNMP or IP). The Path Tool application displays that path in the Path Tool window. This application enables you to check the paths between two IP addresses.
The graphical display in the Path Tool window shows the devices (including routers) involved, the link speeds connecting these SNMP devices, and the interface names. You can run several Path Tool analyses at the same time. The analyses provide color-coded severity levels for each link. Each Path Tool request appears in a separate window.
If your devices contain user-defined community strings, you can change how the Path Tool uses community string by using the -r option in the command line syntax or the .Xdefaults file. For more information, refer to the nmpath online manual page.
You can access the Path Tool application from the main menu to access all devices; if you are using the Site/SunNet/Domain manager platform, you can use the Glyph menu to access a specific device as the source device.
The Path Tool application uses the following windows:
Many IP networks use a Cisco Systems feature called secondary addresses. Secondary addresses allow a user to assign two different IP addresses to one physical interface (on different subnets and/or IP networks). Unfortunately, secondary addresses cannot be discovered via SNMP.
So, if a router has a secondary address and associated subnet mask, the Path Tool application cannot acquire this information. This results in the Path Tool potentially not knowing the subnet mask used on the secondary network. If the Path Tool does not have knowledge of the subnet mask used within a network, it may not be able to determine the route between the source and destination IP addresses.
If the Path Tool application cannot get the secondary address information using SNMP, it searches the /etc/netmasks file for subnet mask information about a network. The/etc/netmasks file is part of the UNIX operating system and contains network numbers and their associated subnet masks. To ensure that the Path Tool can find information about secondary addresses, you must add all of your network numbers and their associated subnet masks in the /etc/netmasks file.
An example of how the file is formatted follows. Use this example as a guideline when adding your network numbers and associated subnet mask information.
128.128 	255.255.248.0
192.6.141 255.255.255.0
This format denotes that the IP network 128.128.0.0 has the subnet mask 255.255.248.0, and the IP network 192.6.141.0 has the subnet mask 255.255.255.0. Trailing zeros are not entered in the /etc/netmasks file.
Figure 3-5 illustrates the Path Tool Route Path window, which is the main Path Tool window.
Table 3-5 describes its components.

If you cannot find your source device icon on the network map or if you do not know the device information, use the menu bar to access the Path Tool application. The following procedure enables you to choose your source or destination device from a list of device names.
To display an analysis of the entire path or any valid subpath, perform the following steps:
Step 1 Select Path Tool.
On Site/SunNet/Domain manager, select Tools>CW - Path Tool.
On HP OpenView, select Diagnose>Network Connectivity>CW - Path Tool.
On NetView, select Diagnose>Network Connectivity>CW - Path Tool.
The Path Tool Source/Destination window appears. (See Figure 3-6.)

Step 2 Enter the source device name.
The path source is the device from which you want the path to start. If you do not know the source device name, click on the Path Source Select button. A Device Selection window appears.
Select your source device from the scroll window and click on OK.
Step 3 Enter a path destination name.
The path destination is the device at which you want the path to end. If you do not know the destination device name, click on the Path Destination Select button. A Device Selection window appears.
Select your destination device from the scroll window and click on OK.
Step 4 Click on the OK button in the Path Tool Source/Destination window to start the process.
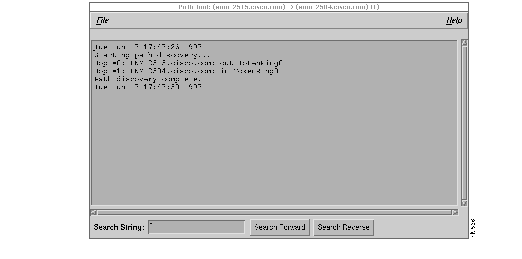
The Path Tool application uses a text browser to display the path hops from the source device to the destination device. (See Figure 3-7.) If a loss of connectivity to the device occurs, a retry popup window appears until connectivity is restored. The following message appears:
The retry popup window skips a hop and proceeds normally until it completes its task. Path Tool reports devices that did not respond to SNMP. You can also save the text information into a file by selecting File>Save As in the Path Tool window.
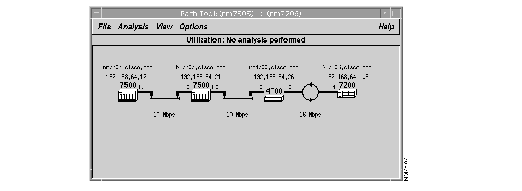
After the Path Tool reaches the destination, it displays a picture of the route. This is the known path from your source device to your destination device. To view the full path route if it is larger than what fits into the window, use the scroller at the bottom of the Path Tool Route window or resize the window. (See Figure 3-5.)
In Figure 3-5, the source device is a UNIX workstation with a host name of fred. An interface named E0 connects the source device to a Cisco router, wilma, at a link speed of 10 Mbps. The Cisco router, pebbles, with a High-Speed Serial Interface (HSSI) H0, connects a Cisco router, dino, with a HSSI interface H0 at a link speed of 4 Mbps.
If the path cannot be discovered using SNMP or other means, the following error message appears: Could not discover desired path via SNMP or any other means.
You can also run the Path Tool application from the Glyph menu. The Glyph menu is the Site/SunNet/Domain manager pull-down menu for a particular device. This procedure enables you to choose your destination device from a list of device names. The source device information is automatically entered after you click on the Cisco icons representing your source device.
To display an analysis of the entire path or any valid subpath using the Glyph menu, perform the following steps:
Step 1 Click on the source device from which you want the path to start and select Tools>CW - Path Tool.
The Path Tool window appears. Note that the source device is automatically entered in the window.
Step 2 Select a destination device that is the device where you want the path to end from the Path Destination scroll window.
The selected device name appears in the Path Destination Selection field.
Step 3 Click on the OK button to start the process.
The Path Tool window appears. If a loss of connectivity to the device occurs, a retry popup window appears until connectivity is restored. You can retry the request or quit.
Step 4 Refer to the previous section, "Using the Path Tool Application," for the results of the Path Tool process.
Use the Path Tool Properties window to set your analysis parameters. You can set continuous utilization and error analyses and your polling interval from the Path Tool Properties window. You can also set a text window to appear each time a utilization or error analysis is performed. This text window contains statistics displayed in the Path Tool window.
After you run the Path Tool application, you can access the Properties window from the Options menu.
Before you perform an analysis, you might want to access the Path Tool Properties window to set your parameters or use the CiscoWorks defaults to run the Path Tool application.
Figure 3-8 illustrates the Path Tool Properties window. Table 3-6 describes its components.
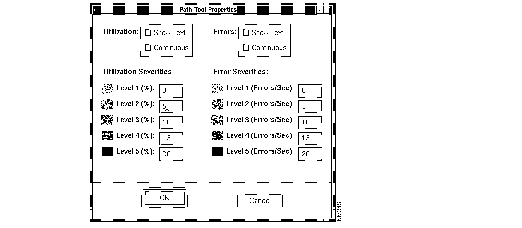
To change the settings in the Path Tool Properties window, use the following steps:
Step 1 On the Path Tool window, select Options>Properties.
Step 2 Change any of the following settings:
Step 3 After you change your property settings, click on the OK button to save your property parameters.
The Path Tool enables you to run the following two types of analysis to measure network activity. This analysis can only be performed on devices with SNMP access.
Refer to the previous section, "Setting Parameters in the Path Tool Properties Window," for more information on changing the defaults in your Properties window. A description of the types of analysis follows.
The utilization analysis function does two things: color codes the links in the path window and provides an optional browser window that shows the usage of each link if you selected Show Text on the Properties window.
Each link between devices is assigned a color based on settings in the Properties window. You can change these utilization settings depending on your network needs. A black link in a path displayed in the Path Tool window indicates that the device did not respond to SNMP.
The Path Tool provides the following defaults for the utilization settings:
For example, in the Path Tool Utilization window, a green link means that the link is using between 0 and 5 percent of the bandwidth.The defaults describe how the color codes relate to real utilizations. For example, green might signify less than 5 percent use, while red might mean over 90 percent utilized. You can set the utilization and error severities in the legend on the Path Tool Properties window.
A key to parameter settings is located on the Path Tool Properties window.
Utilization analysis also provides a browser window showing the actual usage for each link in numerical order. Use the View menu on Path Tool to display the analysis. The utilization analysis measures both ends of the link.
From the Path Tool window, you can perform a utilization analysis of the data in the window.
To analyze the average percentage of bandwidth used by all traffic used in real time, perform the following steps:
Step 1 In the Path Tool window, select View>Utilization (if you have not already done so).
This toggles to the Path Tool Utilization Analysis window. If there is a current utilization analysis, the timestamp indicates when it was performed. If no utilization has been performed, the window indicates that no utilization was performed yet.
Step 2 Select Analysis:Utilization.
The Path Tool window reappears and is timestamped with the utilization analysis confirmation. (See Figure 3-9.)
A Path Tool Utilization Text window also appears if you selected Show Text on the Path Tool Properties window. (See Figure 3-10.)
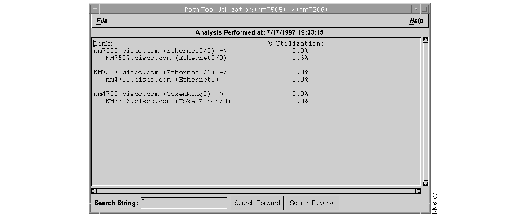
The Utilization text window contains data on the percentage of bandwidth each device interface is using in real time.
For example in Figure 3-10, the Ethernet 0 interface on fred is using only 0.1 percent of the bandwidth, while the Ethernet 8 interface at barney is utilizing 5.9 percent of the bandwidth. Each network administrator must determine what utilization percentage is within the acceptable ranges. Note that device flatrock, which does not have SNMP enabled, shows a percentage as Unknown.
Step 3 If you have a large-scale path, you can search forward or backward for any character string. For example, you might want to search for a device name, an interface name, or a certain percentage. Move your cursor into the window and enter the word Ethernet2 and click on Search Forward. If an Ethernet 2 interface is present in this path, the Utilization text window finds it and highlights it within the browser.
Step 4 To print the data in the Utilization text window to a line printer, select File>Print.
Step 5 To save the data in the Utilization text window to a file, select File>Save As.
Step 6 To exit the Utilization text window and return to the Path Tool window, select File>Exit.
The error analysis function is similar to utilization analysis. However, instead of color coding the real utilization analysis, the Path Tool color codes the errors per second on the link. Each link between devices is assigned a color based on settings in the Properties window. You can change these error settings based on your network needs. A black link in a path displayed in the Path Tool window indicates that the device did not respond to SNMP.
The Path Tool provides the following defaults for the error analysis settings:
For example, in the Path Tool error utilization window, if a link is yellow, this link is seeing from 10 to 15 errors per second. The interface error measurement includes packets with errors as a percentage of total packets (good packets plus error packets) on an interface.
Figure 3-8 shows the Properties window that the Path Tool uses to determine what colors to assign to the error status of each line.
As another example, a link with no errors may be green, while a link with an 80 percent error rate may be red. The Path Tool only checks errors appropriate to the type of media for the link. For example, on an Ethernet it would look at errors specific to Ethernet interfaces.
From the Path Tool window, you can perform an error analysis on the data in the window.
An error analysis collects different information depending on what type of interface your device has. Table 3-7 describes the error analysis variables for both non-Cisco and Cisco devices according to their interface types.
| Interface | Objects Polled | MIB Object Names |
|---|---|---|
| Non-Cisco device (all interfaces) | Input errors
Output errors | ifInErrors
ifOutErrors |
| Cisco device--Ethernet | Collisions
Runts Giants CRCs Restarts Resets | locIfInCollisions
locIfInRunts locIfInGiants locIfInCRC locIfRestarts locIfResets |
| Cisco device--serial
| Frame errors
Overruns Ignoreds Aborts Restarts Resets Carrier transitions | locIfInFrame
locIfInOverrun locIfInIgnored locIfInAbort locIfRestarts locIfResets locIfCar Trans |
| Cisco device--FDDI or Token Ring | Runts
Giants CRCs Restarts Resets | locIfInRunts
locIfInGiants locIfInCRC locIfRestarts locIfResets |
To analyze the number of packets with errors as a percentage of total packets (good packets plus error packets) in real time, perform the following steps:
Step 1 On the Path Tool window, select View>Errors.
This toggles to the Path Tool Errors Analysis window.
Step 2 On the Path Tool window, select Analysis>Errors.
The Path Tool window reappears timestamped with the error analysis confirmation. (See Figure 3-11.)
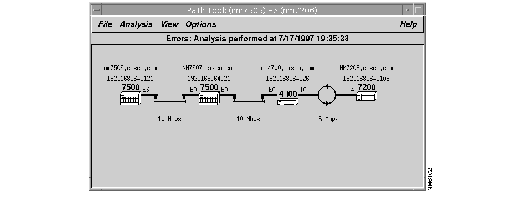
An Errors Text window also appears if you selected Show Text in the Path Tool Properties window. (See Figure 3-12.)
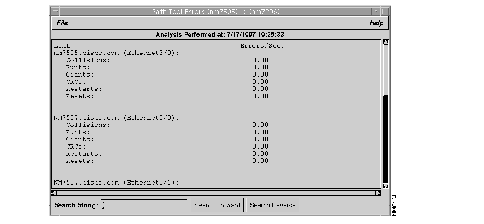
The Errors Text window contains data on the percentage of errors per second based on the type of line (Ethernet, serial, Token Ring, FDDI).
For example, in Figure 3-12, fred is a Cisco device with an Ethernet connection, so statistics are gathered for collisions, runts, giants, CRCs, restarts, and resets. The serial connection (not in picture) on dino gathers statistics on frame errors, overruns, ignoreds, aborts, restarts, resets, and carrier transitions.
Step 3 If you have a large-scale path, you can search forward or backward for any character string. For example, you might want to search for a device name, an interface name, or a certain percentage. Move your cursor into the window, enter the word carrier transitions, and click on Search Forward. If a serial line is present in this path, the Errors text window will find it and highlight it within the browser.
Step 4 To print the data in the Errors text window to a printer, select File>Print.
Step 5 To save the data in the Errors text window to a file, select File>Save As.
Step 6 To exit the Errors text window and return to the Path Tool window, select File>Exit.
If the Path Tool is using methods other than SNMP to discover a path, it may encounter difficulties determining the correct path where parallel routers with parallel links exist. Such a setup appears in Figure 3-13. The way to avoid this problem is to enable SNMP on one of the two parallel devices.


The Real-Time Graphs application monitors the behavior of devices suspected of operating in a degraded mode or introducing erratic behavior in traffic patterns, error status indications, or statistics. Use the Errors and Queues interface health buttons to display quick information about diagnosing problems in your network. Errors and Queues are the only buttons on the Real-Time Graphs window explained in this chapter.
Real-Time Graphs is also useful for managing and planning network loads and use. For more information on performance management, refer to section "Using the Real-Time Graphs" in the "Performance Management" chapter.
The Real-Time Graphs application monitors and graphs variables for a single device. Multiple devices can be monitored simultaneously by opening more than one application. In addition, you can merge graphs to present the data in one graph.
If you are using Site/SunNet/Domain manager, the Real-Time Graphs application uses the Site/SunNet/Domain manager Grapher. For information on customizing your graph, see the Site/SunNet/Domain manager User's Guide. If you are using HP OpenView, the Real-Time Graphs application uses the OpenView grapher, xnmgraph.. For NetView , Real-Time Graphs uses NetView's grapher. For more information about customizing your graph, refer to the online help in the Grapher window.
Figure 3-14 illustrates the Real-Time Graphs window. Table 3-8 describes its components. Grayed-out buttons on CiscoWorks application windows indicate inactive functions.
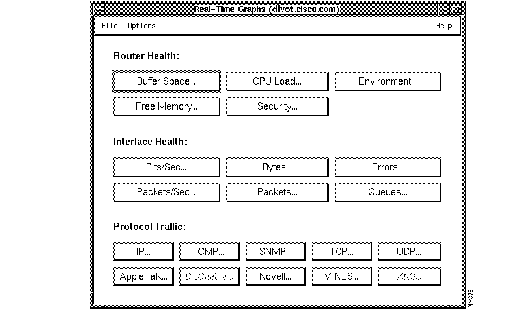
| Component | Subcomponent | Description |
|---|---|---|
| File | Print
Exit | Opens the screen capture facility of your system.
Opens the current window. |
| Options | Polling Frequency | Changes polling rate. Can be set using the polling slider or entering a value in the Polling Frequency field and pressing Return. Default = 2 seconds. |
| Help | On Version
On Real-Time Graphs | Displays the CiscoWorks version information for this application.
Provides help text on the current window. |
| Router Health
| Buffer Space
CPU Load Environment Free Memory Security | Refer to Table 4-5 in Chapter 4 for a detailed description of the router health buttons.
|
| nterface Health1
| Bits/Sec
Bytes Errors Packets/Sec Packets Queues | Refer to Table 4-6 in Chapter 4 for a detailed description of the interface health buttons.
|
| Protocol Traffic
| IP
ICMP SNMP TCP UDP AppleTalk DECnet IV Novell VINES XNS
| Refer to Table 4-7 in Chapter 4S for a detailed description of the protocol traffic buttons.
|
To create a graph with real-time device data (specifically for error information), perform the following steps:
Step 1 Click on the device and select Tools>CW - Real-Time Graphs.
The Real-Time Graphs window appears. (See Figure 3-14.)
Step 2 Gather data on interface health by clicking on either Errors or Queues. For this example, click on Errors.
These buttons collect MIB object information that will assist you in diagnosing your network problem. Table 3-9 describes these buttons and the MIB object descriptions they poll.
| Buttons | Description | MIB Object Descriptions |
|---|---|---|
| Errors | Displays the number of input packets with various characteristics for Cisco devices. | For Ethernet, 802.3 CSMA/CD, starLAN:
locIfCollisions locIfInRunts locIfInGiants locIfInCRC locIfResets locIfRestarts For FDDI and Token Ring: locIfInRunts locIfInGiants locIfInCRC locIfResets locIfRestarts For serial (Cisco-specific): locIfInFrame locIfInOverrun locIfInIgnored locIfInAbort locIfResets locIfRestarts locIfCarTrans |
| Displays the number of input packets with various characteristics for any non-Cisco devices. | For serial (non-Cisco):
ifInErrors ifOutErrors | |
| Queues | Displays the number of packets dropped because the input or output queue was full for Cisco devices. | locIfInputQueueDrops
locIfOutputQueueDrops |
The real-time graphs you create use the polling frequency default set in the Options menu. To enter a new polling frequency, select Options>Polling Frequency. A Polling Frequency window appears. Enter the polling frequency and click on OK.
Step 3 After you click on the Errors button, a Real-Time Grapher Choose window appears.
If you receive an SNMP error message, check the device's SNMP configuration.
Step 4 Select the interface for which you want to receive errors information and click on OK.
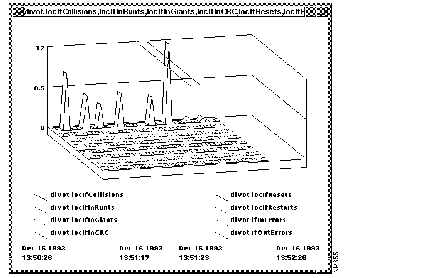
The grapher window appears. Figure 3-15 displays the real-time graph for errors.
Seconds later, a Results Grapher window also appears. The devices and variables you selected appear in the scroller window.
 | Caution When you are finished, you must remove the graphs using the Results Grapher window, or the graphs will continue to poll. |
The Real-Time Graphs application uses the Site/SunNet/Domain Manager Grapher. If you want to change the appearance of your real-time graph, you need to use the Site/SunNet/Domain manager Results Grapher window. (See Figure 3-16.)

You can perform the following tasks using the Results Grapher:
To create a graph with real-time device data (specifically for error information), perform the following steps:
Step 1 Click on the device and select Monitor>CW - Real-Time Graphs.
The Real-Time Graphs window appears. Refer to Figure 3-14.
If you receive an SNMP error message, check the device's SNMP configuration under the Options menu. HP OpenView and NetView use public as the default for the set community string. If you have a device or devices that use other community strings, you will need to configure them appropriately using Options>SNMP Configuration.
Step 2 Gather data on interface health by clicking on either Errors or Queues. For this example, click on Errors.
These buttons collect MIB object information that will assist you in diagnosing your network problem.
The real-time graphs you create use the polling frequency default set in the Options menu. To enter a new polling frequency, select Options>Polling Frequency. A Polling Frequency window appears. Enter the polling frequency and click on OK.
Step 3 After you click on the Errors button, a Real-Time Grapher Choose window appears.
Step 4 Select the interface for which you want to receive error information and click on OK.
The grapher window appears. Figure 3-17 displays the real-time graph for errors.
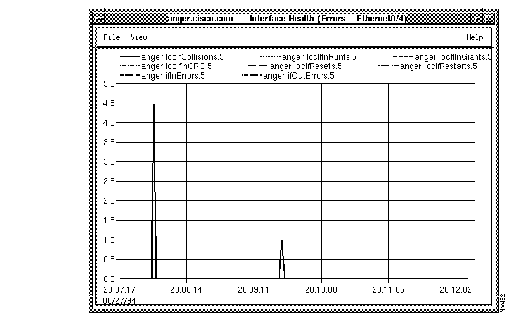
To change graph properties, use the View menu items in the OpenView Grapher window. For more information about changing graph properties, refer to the online help in the Grapher window.

CiscoWorks provides a unique interface to Cisco routers or communication servers on your network. Using the Show Commands application, you can view device data with the click of a mouse.
Figure 3-18 illustrates the Show Commands window. Table 3-10 describes its components.
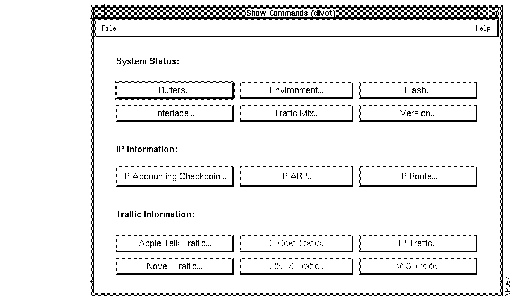
| Component | Definition | When to Use |
|---|---|---|
| File>Print
File>Exit | Opens the screen capture facility of your system.
Closes the current window. | To perform the tasks described in the adjacent column.
|
| Help>On Version
| Displays CiscoWorks version information for this application.
Provides help text for the current window. | To perform the tasks described in the adjacent column.
|
| Buffers | Displays statistics for the buffer pools on the network server. | If the input queue count on an interface is consistently nonzero. Use to determine if you need to adjust initial buffer pool settings and the limits at which temporary buffers are created and destroyed. |
| Environment | Displays temperature and voltage information. | If you have received a warning or shutdown message; query the environmental monitor card to determine if a measurement is at a warning tolerance. Available only on devices with environmental monitor cards, for example, the Cisco AGS+ router. |
| Flash | Displays files in Flash memory for a Cisco device. | If you are using Flash memory to load a configuration file into a Cisco device, you can check to ensure that the file is uncorrupted and ready to load. |
| Interface | Displays status of device interfaces. | If you have a problem after reconfiguring a device. You can also use this command as a monitoring tool. |
| Traffic Mix1 | Displays status information on all protocol traffic including device, protocol, and interface data. | If you want to check protocol traffic activity. |
| Version | Displays the software title and version and cumulative uptime since the last reload of the software for the selected device. For routers running Software Release 9.1, this window displays traffic per protocol on each interface. | If it is necessary to contact technical support; have all version information ready for your technical support specialist. |
| IP Accounting Checkpoint | Displays the checkpointed accounting database, which contains source and destination addresses and the total number of packets and bytes for each address pair. | If you want to check accounting database information. |
| IP ARP | Displays the Address Resolution Protocol (ARP) cache. | If you want to check the records of the correspondence for each network address (an IP address, for example) and LAN hardware addresses (MAC addresses). |
| IP Route | Displays the current state of the IP routing table. | If you want to check routing information. |
| AppleTalk Traffic | Displays AppleTalk traffic statistics. | If you want to check information on AppleTalk-specific traffic. |
| DECnet Traffic | Displays DECnet traffic statistics. | If you want to check information on DECnet-specific traffic. |
| IP Traffic | Displays IP statistics. | If you want to check IP-specific traffic information. |
| Novell Traffic | Displays Novell traffic statistics. | If you want to check Novell-specific traffic information. |
| VINES Traffic | Displays VINES traffic statistics. | If you want to check VINES-specific traffic information. |
| XNS Traffic | Displays XNS packet statistics. | If you want to check XNS-specific traffic information. |
To access the individual Show Commands windows, perform the following steps:
Step 1 Select Show Commands.
On Site/SunNet/Domain manager, click on the device and select Tools>CW - Show Commands.
On HP OpenView, select Diagnose>CW - Show Commands.
On NetView, select Diagnose>CW - Show Commands.
The Show Commands window appears. (See Figure 3-18.) If a loss of connectivity to the device occurs, a retry popup window appears until connectivity is restored. You can retry the request or quit.
Step 2 To request specific system status, IP information, or traffic information, click on the respective Show Commands button.
Step 3 To exit the Show Commands window, select File>Exit.
For more detailed information on show commands, refer to the Router Products Configuration and Reference publication.
Figure 3-19 illustrates a Show Commands subwindow. Table 3-11 describes the components of the individual Show Commands subwindows.
The show commands listed in Table 3-11 all have their own Show window. There are several show commands. Examples of a selection of show windows appear later in this section.
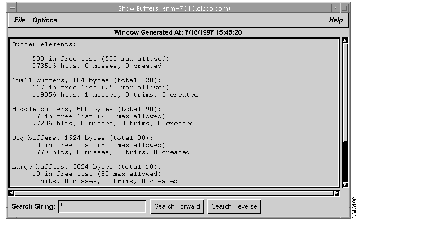
| Component | Subcomponent | Description |
|---|---|---|
| File | Print
Save As Close | Opens the Print Using lpr command window.
Saves the contents of the current window to a file. Closes the current window. |
| Option | Refresh | Redisplays the current window with updated data. |
| Help | On Version
On Show Commands | Displays the CiscoWorks version information for this application.
Displays a manual page on the current window. |
| Search String field | Provides a field for the character string to locate in text. | |
| Search Forward | Searches forward for a character or character string in the text. | |
| Search Reverse | Searches backward for a character or character string in the text. |
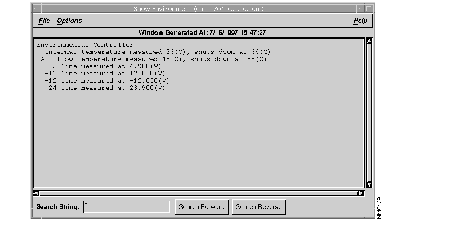
From the Show Commands window, click on the Environment button to display the Show Environment window. (See Figure 3-20.)
The Show Environment window displays temperature and voltage information on the AGS+ or Cisco 7000 router console. You can access the Show Environment window to check data after you receive a warning or shutdown message from your AGS+ or Cisco 7000 router.
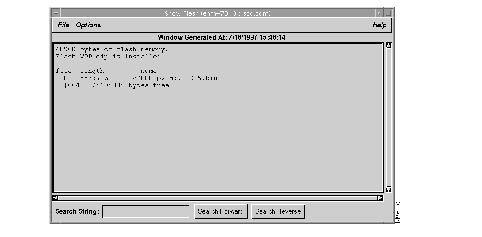
From the Show Commands window, click on the Flash button to display the Show Flash window. (See Figure 3-21.)
The Show Flash window provides information on Flash memory contents for Cisco devices with Flash memory, such as a Cisco 7000 router.
From the Show Commands window, click on the Traffic Mix button to display the Show Traffic Mix window. (See Figure 3-22.)
The Show Traffic Mix window provides all traffic information, regardless of protocol. This command polls the router and shows statistics over a short period of time.
This Show Command is a feature specific to CiscoWorks; it is not a router EXEC show command. You can use this command as a quick view of traffic activity.
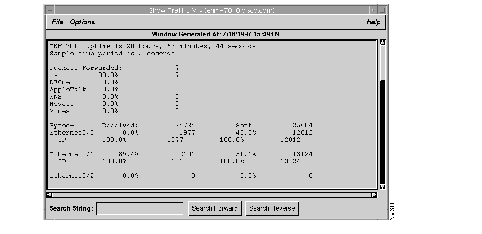
The Show Traffic Mix window in Figure 3-22 contains the following three sections.
From the Show Commands window, click on the IP Accounting Checkpoint button to display the Show IP Accounting Checkpoint window. (See Figure 3-23.)
The Show IP Accounting Checkpoint window displays the checkpointed database. The output contains source and destination addresses, as well as the total number of packets and bytes for each address pair. Use this information to check resource usage.
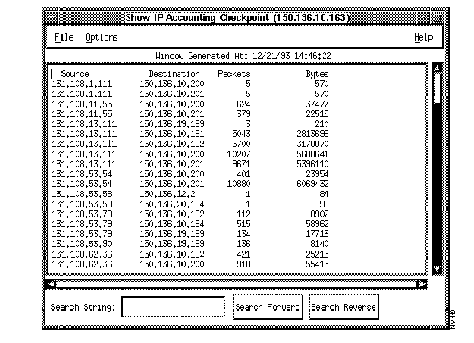
If there is no IP accounting checkpoint on the selected router, the following error message will appear:
No IP accounting checkpoint table on <device_name>.
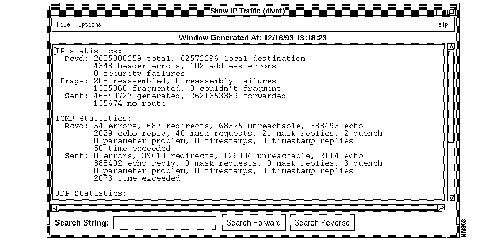
On the Show Commands window, click on the IP Traffic button to display the Show IP Traffic window. (See Figure 3-24.)
The Show IP Traffic window displays statistics on IP protocol operation.

The Health Monitor application provides information about the overall health of a device and allows you to access to several CiscoWorks applications on one window.
You can perform the following tasks from the Health Monitor window:
Figure 3-25 illustrates the Health Monitor window. Table 3-12 describes its components.
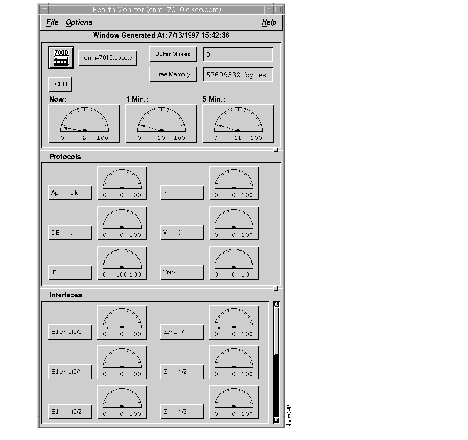
The Health Monitor window in Figure 3-25 contains the following three panels. To resize each panel, click on the panel button, also known as a sash, and shift the panel according to the view you desire.
The Health Monitor window can be changed to display data in a text format. For information on how to change the data display default, refer to the nmhealth manual page.
Table 3-12 describes the Health Monitor window components and contains references to two applications: Show Commands and Real-Time Graphs. These applications are represented in the window menuing system by the icons in Figure 3-26.
| Component | Subcomponent | Description |
|---|---|---|
| File | Print
Exit | Opens the screen capture facility for your system.
Opens the current window. |
| Options | Set Polling Frequency
Properties | Allows you to change the polling rate. The default is 60 seconds.
Allows you to change the data display format from a graphical dial to text and the format of free memory from bytes to kilobytes. |
| Help | On Version
On Health Monitor | Displays the CiscoWorks version information for the application.
Displays help text for the current window. |
| Device1 | Show Commands | Provides Show Version command. |
| Buffer Misses | Show Commands
Real-Time Graphs | Provides Show Buffers command. |
| CPU | Real-Time Graphs | Provides CPU data graph. |
| Free Memory | Real-Time Graphs | Provides free memory data graph. |
| Protocols | Show Commands
Real-Time Graphs | Provides show protocol command. |
| Interfaces | Show Commands
Real-Time Graphs | Provides Show Interface command. |

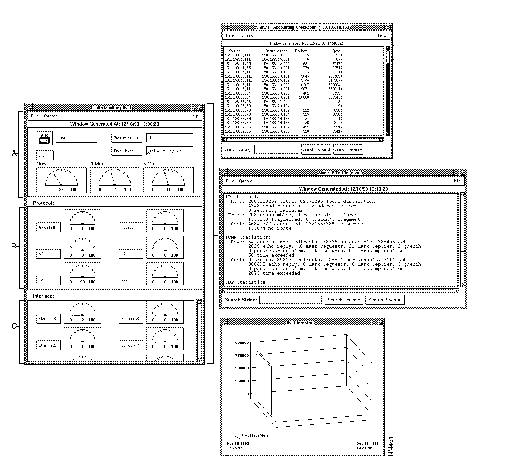
Figure 3-27 illustrates the following Show Commands and Real-Time Graphs applications you can access from within the Health Monitor window:
Depending on the network management platform you are using, some of the windows in Figure 3-27 might look different.
To use the Health Monitor window, perform the following steps:
Step 1 Select Health Monitor.
On Site/SunNet/Domain manager, click on the device and select Tools>CW - Health Monitor.
On HP OpenView, select Monitor>CW - Health Monitor.
On NetView, select Monitor>CW - Health Monitor.
The Health Monitor message window shown in Figure 3-28 appears while the Health Monitor gathers information. After the device information is loaded, the Health Monitor window appears.

If a loss of connectivity to the device occurs, a retry popup window appears until connectivity is restored. The following message appears:
The retry popup window restarts the timer and proceeds when the Cisco device is available. You can retry the request or quit.
Step 2 To change the polling frequency for this device, select Options>Set Polling Frequency.
A Health Monitor Polling Frequency window appears. To change the polling frequency, use the polling slider or enter a new value in the Polling Frequency field and press Return.
Step 3 To change the window properties, select Options>Properties.
A Health Monitor Properties window appears. (See Figure 3-33.)
Step 4 Change the properties you want and click on OK.
Step 5 Graph a device's memory usage by clicking on the Free Memory button and selecting the Real-Time Graphs icon.
The real-time graph appears seconds later. (See Figure 3-29 if you are using the Site/SunNet/Domain manager platform. See Figure 3-30 if you are using the HP OpenView or NetView platform.)
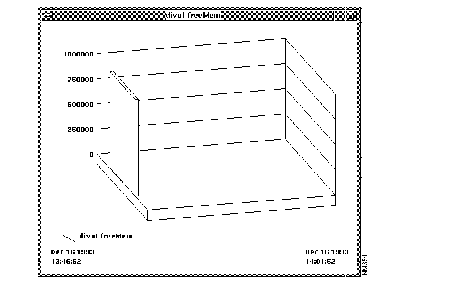
The Cisco device divot displays a free memory of almost 2 megabytes (MB). The start time of the real-time graph appears in the left bottom corner of the graph. The current poll time appears in the right bottom corner of the graph. The legend for this real-time graph includes the MIB object for free memory (freeMem).
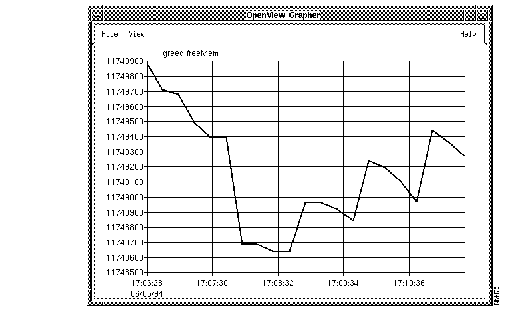
The graph in Figure 3-30 shows the free memory of the Cisco device greed. The start time of the real-time graph appears in the left bottom corner of the graph; at the start time, greed displays 11,749,900 bytes of free memory. The current poll time appears in the right bottom corner of the graph. The graph also displays the MIB object for free memory (freeMem) in the legend above the graph.
Step 6 Graph CPU load data by clicking on the CPU button and selecting the Real-Time Graphs icon.
The real-time graph appears. (See Figure 3-31) if you are using the Solstice Site/SunNet/Domain manager platform. (See Figure 3-32 if you are using the HP OpenView or Netview platform.)
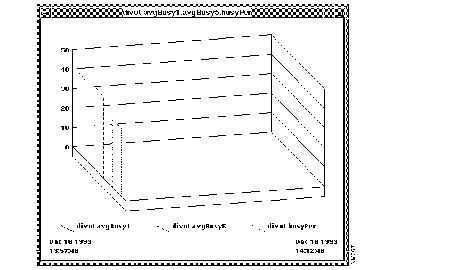
The Cisco device divot, shown in Figure 3-31, displays the CPU load for this device. The legend includes the three MIB objects for avgBusy1, avgBusy5, and busyPer (the CPU busy percentage for 1- and 5-minute averages and for the last 5-second period). The start time of the real-time graph appears in the bottom left corner of the graph. The current poll time appears in the bottom right corner of the graph.
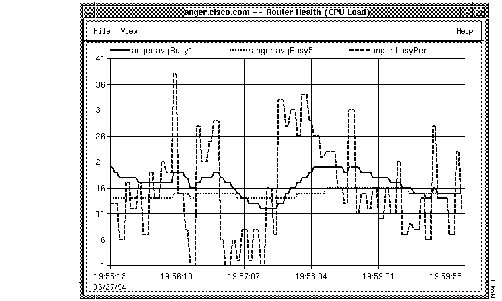
Figure 3-32 displays the CPU load for the Cisco device anger. The legend includes the three MIB objects for avgBusy1, avgBusy5, and busyPer (the CPU busy percentage for 1- and 5-minute averages and for the last 5-second period). The start time of the real-time graph appears in the bottom left corner of the graph.
Figure 3-33 illustrates the Properties window for the Health Monitor application. Table 3-13 describes its components.
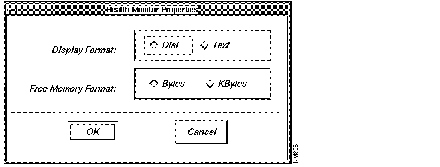
| Component | Subcomponent | Description |
|---|---|---|
| Display Format | Dial/Text | Toggles format of data display from a graphical dial to a text box. |
| Free Memory Format | Bytes/KBytes | Toggles format of free memory from bytes to kilobytes. |
To alter Health Monitor properties, perform the following steps:
Step 1 To change the Display Format, click on Dial or Text.
Step 2 To change the Free Memory format, click on Bytes or kilobytes (Kbytes).
Step 3 To save these property changes and exit the window, click on OK.

When you need to find an onsite network manager or support contact quickly, use the Contacts application. To enter contact information, access the Device Management application and enter the information using the Devices window. For instructions on entering device contact data, refer to the "Device Management" chapter.
As part of your fault management procedures, you might choose to use device contacts as your quick-access tool to find your emergency contact person. After you enter the necessary information in the Contacts window, you can access this important information through the Contacts application.
To access your device contact data, complete the following steps:
Step 1 Select Contacts.
On Site/SunNet/Domain manager, click on the device for which you need contact information and select
Tools>CW - Contacts.
On HP OpenView, select Monitor>Description>CW - Contacts.
On NetView, select Monitor>Description>CW - Contacts.
A Contacts browser window appears containing the contact data. (See Figure 3-34.)
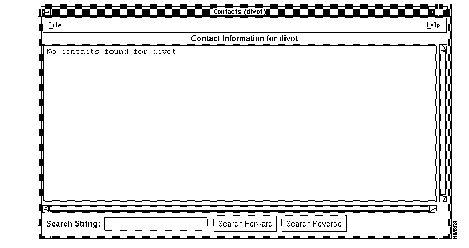
If you think a contact was associated with a device but is not located in the list, review the device contacts assignments in the Device Management application.
Step 2 To close the window, select File>Exit.
|
|