|
|

This chapter describes the steps for running IPM. It includes the following major sections:
The procedure for starting IPM differs depending on your operating system.
cd /usr/cwb-ipm/bin
runipm
cd /<install directory>/bin
cd /opt/CSCOipm/bin
runipm
When the IPM application starts, it displays the IPM main window, as shown in Figure 4-1.

When you start IPM for the first time, this window contains no collectors. As you configure collectors, they are displayed in this window. Each collector is a combination of a configured source, target, and operation. For each collector, you specify parameters for gathering statistics, generating event notifications, and scheduling.
To collect response-time data using IPM, you must define a collector in the source router. A collector is a definition of the source router, the target device, an operation, and the frequency time that the collector is to run.
There are two methods for defining a collector. You can define source routers, targets, and operations individually and then define a collector comprised of a previously defined source router, target, and operation. Or you can define the collector first, after which IPM will prompt you to define each of the components.
To define a new IPM collector with new source, target, and operation components, follow these steps.
Step 1 From the Internetwork Performance Monitor main window (Figure 4-1), select Edit>Add Collector. The IPM-Add Collector window is displayed, as shown in Figure 4-2.
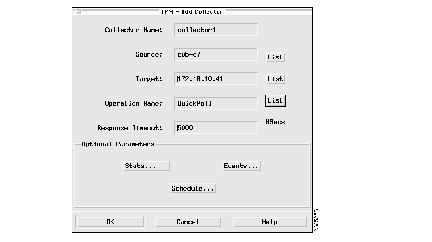
Step 2 In the Collector Name field, enter a symbolic name that you want to assign to this collector.
This name will appear in the Collector field on the Internetwork Performance Monitor main window. Each collector name must be unique in the IPM database. This name can be from 1 to 32 characters; do not include special characters such as ! @ # $ % ^ & * ' '' or |.
Step 3 In the Source field, enter the name that you want to assign to the source router.
Step 4 In the Target field, enter the name that you want to assign to the target.
Step 5 In the Operation Name field, enter the name that you want to assign to the operation.
Step 6 In the Response Timeout field, enter the number of milliseconds that the collector should wait for a response to an operation. If the collector waits longer than this value, a timeout occurs and the timeout counter is incremented in the displayed results.
The timeout value must be less than the selected Interval. For example, if you set the Interval to start the collector every 60 seconds, the timeout value must be less than 60 seconds.
Valid values are 0 through 60480000 milliseconds.
Step 7 If you choose to configure the data collection statistics, click Stats. This feature allows you to control how much and what type of statistics are stored at the source router. For instructions, see the "Configuring the Data Collection Statistics" section.
Step 8 If you choose to configure the notification and thresholds, click Events. This feature allows you to configure the collector to send notifications when threshold values are violated and when the collector loses a connection, reestablishes a connection, times out, and first succeeds after a timeout. For instructions, see the "Configuring the Notification and Thresholds" section.
Step 9 If you choose to define the schedule for the collector, click Schedule. This feature allows you to specify when the collector is to be activated and how long it will remain configured in the source router while inactive. For instructions, see the "Scheduling the Collector" section.
Step 10 Click OK when you have finished configuring this collector.
For the source, target, and operation, IPM displays confirmation boxes that remind you that these components have not yet been configured and gives you the option of configuring them at this point in the collector configuration process.
Step 11 For each of the components, click Configure. IPM displays the configuration window for each component in turn, allowing you to configure it. After you have configured each of the collector components, you return to the IPM Display window; the collector that you have defined appears in the list.
For instruction on configuring sources, targets, and operations, see the "Configuring an IPM Source," "Configuring IPM Targets," and "Configuring an IPM Operation" sections.
IPM source routers are the routers from which you want to gather the response time data. Each source router must contain the Cisco IOS RTR feature and an SNMP agent.
To view a list of configured source routers, select Admin>Source from the Internetwork Performance Monitor main window. The IPM-Configure Source window is displayed, as shown in Figure 4-3.

This window displays source routers that you have already configured. From this window, you can add a new source router, change the configuration of an existing source, or delete an existing source.
To add a new source, follow these steps:
Step 1 From the IPM-Configure Source window (Figure 4-3), select Edit>Add. The IPM-Add Source window is displayed, as shown in Figure 4-4.
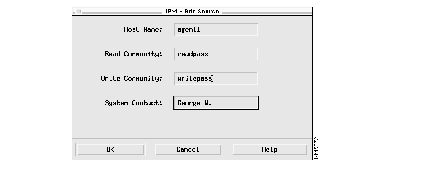
Step 2 On the IPM-Add Source window, enter data in these fields:
Step 3 Click OK to configure this source. IPM will then attempt to locate this host. If the host is successfully located, IPM adds it to the IPM-Configure Source window. If IPM cannot locate the host, IPM displays an error message and redisplays the IPM-Add Source window.
To change the configuration of a source, follow these steps:
Step 1 From the IPM-Configure Source window (Figure 4-3), select a source.
Step 2 From the menu bar, select Edit>Update. The IPM-Update Source window is displayed, as shown in Figure 4-5. Notice that the window title bar displays the name of the source you have selected; in this case, cwb-c5.
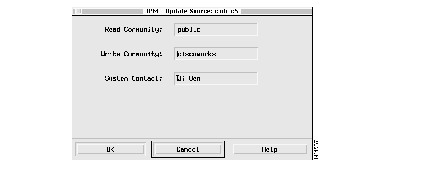
Step 3 You can change these source attributes:
Step 4 Click OK to implement the change.
To delete a source, perform the following steps:
Step 1 From the IPM-Configure Source window (Figure 4-3), select a source.
Step 2 From the menu bar, select Edit>Delete. The source is deleted from the IPM - Configure Source window.
IPM targets are destination devices for which you want to gather response-time data. A target can be an SNA host or an IP-addressable device.
To configure a target, select Admin>Target from the Internetwork Performance Monitor main window (Figure 4-1). The IPM-Configure Target window is displayed, as shown in Figure 4-6.

This window displays any targets that you have already defined. From this window, you can add new targets or delete existing targets.
To add a new target, follow these steps:
Step 1 From the IPM-Configure Target window (Figure 4-6), select Edit>Add. The IPM-Add Target window is displayed, as shown in Figure 4-7.
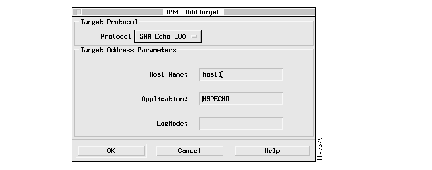
Step 2 On the IPM-Add Target window, enter data in these fields:
Step 3 Click OK.
To delete a target, perform the following steps:
Step 1 From the IPM-Configure Target window (Figure 4-6), select a target.
Step 2 From the menu bar, select Edit>Delete. The target is deleted from the IPM-Configure Target window.
An IPM operation is an alias for a set of parameters used in measuring response time. You configure an operation by associating an operation name with a network protocol, such as IP Echo or PathEcho, that you want to use to measure response times from the source router to the target device. To configure an IPM operation, select Admin>Operation from the IPM main window (Figure 4-1). The IPM - Configure Operation window is displayed, as shown in Figure 4-8.

This window displays any operations that you have already defined. From this window, you can add new operations or delete existing operations.
To add a new operation, follow these steps:
Step 1 From the IPM-Configure Operation window, select Edit>Add. The IPM-Add Operation window is displayed, as shown in Figure 4-9.
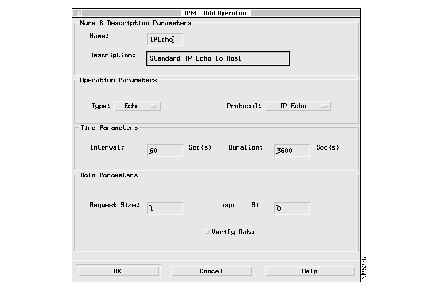
Step 2 Enter data in these fields:
Name--Enter a symbolic name that you want to assign to this operation. A name will appear in the Operation Name field when you configure a collector. This name can be from 1 to 32 characters; do not include special characters such as ! @ # $ % ^ & * ' '' or | in the name.
Description--Enter some descriptive text for your own use. This description can be from 1 to 255 characters; do not include special characters such as ! @ # $ % ^ & * ' '' or | in the description.
Type--From the Type drop-down list, select one of the following:
Protocol--From the Protocol drop-down list, select the protocol to be used by the collector. Possible values are as follows:
Interval--Enter how often, in seconds, the collector at the source executes the operation to measure response time to and from the target. The default is every 60 seconds. The valid range is from 10 to 3600 seconds (1 hour).
For normal operation, do not set the interval value to fewer than 60 seconds. A greater interval is not needed when keeping statistics (the default) and can slow down the network.
If the collector takes longer to execute the operation than the specified frequency value allows, the busy statistical counter in the output display is incremented instead of starting another operation.
Duration--Enter the number of seconds that the collector is to actively collect response-time information at the source router. The default is 3600 seconds (one hour). The valid range is from 0 to 1987200 seconds (23 days).
Request Size--Enter the size of the protocol data, in bytes, in the payload of the collector's request packet. The valid range is from 0 to the protocol's maximum allowable size, 16384. The default is 1 byte.
Response Size--Enter the size, in bytes, of the protocol data in the payload in the collector's response packet. For SNA echo protocols, the default is 0 bytes. For IP echo protocols, the default is the same value as the request size. The valid range is from 0 to 16384 bytes.
Verify Data--Select Verify Data to have the source router check the echo response for unexpected data. When the response contains unexpected data, the Verify Data counter is incremented in the displayed results.
Step 3 Click OK.
To delete an operation, perform the following steps:
Step 1 From the IPM-Configure Operation window (Figure 4-8), select an operation.
Step 2 From the menu bar, select Edit>Delete.
After you configure the IPM SNMP agents, targets, and operations, you can configure a collector, which is a combination of a source, target, and operation. For each collector, you specify parameters for gathering statistics, generating event notifications, and scheduling.
To add a new IPM collector, follow these steps:
Step 1 From the Internetwork Performance Monitor main window (Figure 4-1), select Edit>Add Collector. The IPM-Add Collector window is displayed, as shown in Figure 4-10.
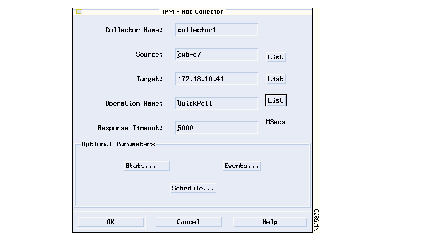
Step 2 Enter data in the following fields.
Collector Name--Enter a symbolic name that you want to assign to this collector. This is the name that will appear in the Collector field on the Internetwork Performance Monitor main window. Each collector name must be unique in the IPM database. This name can be from 1 to 32 characters; do not include special characters such as ! @ # $ % ^ & * ' '' or | in this name.
Source--Enter the name of a configured IPM source. You can either enter the name, or click List and select the name from the Source List window. If you enter the name of a source that you have not yet configured, IPM displays the IPM-Add Source window, in which you can define the new source.
Target Address--Enter the name of a configured target. You can either enter the name or click List and select the name from the Target List window. If you enter the name of a target that you have not yet configured, IPM displays the IPM-Add Target window, in which you can define the new target.
Operation Name--Enter the name of a configured operation. You can either enter the operation name or click List and select the name from the Operations List window. If you enter the name of an operation that you have not yet configured, IPM displays the IPM-Add Operation window, in which you can define the new operation.
Response Timeout--Enter the number of milliseconds that the collector should wait for a response to an operation. If the collector waits longer than this value, a timeout occurs and the timeout counter is incremented in the displayed results.
The timeout value must be less than the selected Interval. For example, if you set the Interval to start the collector every 60 seconds, the timeout value must be less than 60 seconds.
Valid values are 0 through 60480000 milliseconds. The default value is 5000 milliseconds.
Step 3 If you choose to configure the data collection statistics, click Stats. This feature allows you to control how much and what type of statistics are stored at the source router. For instructions, see the "Configuring the Data Collection Statistics" section.
Step 4 If you choose to configure the notification and thresholds, click Events. This feature allows you to configure the collector to send notifications when threshold values are violated and when the collector loses a connection, reestablishes a connection, times out, and first succeeds after a timeout. For instructions, see the "Configuring the Notification and Thresholds" section.
Step 5 If you choose to define the schedule for the collector, click Schedule. This feature allows you to specify when the collector is to be activated and how long it will remain configured in the source router while inactive. For instructions, see the "Scheduling the Collector" section.
Step 6 Click OK when you have finished configuring this collector.
You can control how much and what type of statistics are stored at the source router (for PathEcho only).
To configure data collection statistics for this collector, perform these steps:
Step 1 Click the Stats button on the IPM-Add Collector window (Figure 4-10). The IPM-Configure Data Collection Statistics window is displayed, as shown in Figure 4-11.

Step 2 Enter data in these fields:
Number of Hourly Groups--Enter the number of hourly groups for which statistics are maintained at the source router for this collector. The default is 2 hourly groups. The possible values are 0 and 2:
0--No statistical data is kept for IPM, but you can turn on alerts and traps for the supported events (timeout, connection loss, and threshold violation), as described in the section "Configuring the Notification and Thresholds."
2--Statistical data is kept in two 1-hour groups.
Think of each hourly group as a bucket into which the source puts collector statistics gathered over the preceding hour. At the end of the first hour, the SNMP agent puts that hour's statistics into bucket. At the end of hour 2, the agent puts that hour's statistics into bucket 2. At the end of hour 3, it starts again at bucket 1, overlaying the statistics that were previously in that bucket. When a collector collects statistics for more hours than there are hourly groups, the agent wraps to the first hourly group again and again. The newer information continually replaces the oldest information.
Number of Paths--Enter the number of different paths, between the source and the target, for which statistics are to be maintained by this collector. A path is the route the collector's request packet takes through the network to get to the target. A collector can take a different path to reach the target for each IPM operation. When the number of paths reaches the value specified here, no further path information is stored.
This option is used only when a collector has the operation type PathEcho (selected in the IPM-Add Operation window). For these collectors, the valid range is 0 through 50. The default is 5.
For collectors of operation type Echo, the number of paths is restricted to 1 by the source agent and cannot be changed.
Number of Hops-Enter the number of hops for which statistics are maintained for each path for this collector. One hop is the passage of a timed packet from this router to the next network device in the path. The next network device is (assumed to be) a device along the path to the destination (including the destination) when the collector type is PathEcho, or just the destination when the type is Echo. When the number of hops reaches the size specified by this value, no further hop information is stored.
This option is used only when a collector has the operation type PathEcho (selected in the IPM-Add Operation window). For these collectors, the valid range is 0 through 64. The default is 16.
For collectors of operation type Echo, the number of hops is restricted to 1 by the agent and cannot be changed.
Step 3 Click OK.
You can configure the collector to send notifications when threshold values are violated and when the collector loses connection, reestablishes connection, times out, and first succeeds after a timeout. To configure the events and threshold values, perform these steps:
Step 1 Click Events on the IPM-Add Collector window (Figure 4-10). The IPM-Configure Events & Thresholds window is displayed, as shown in Figure 4-12.
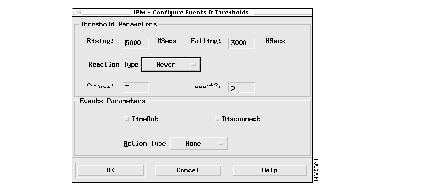
Step 2 Enter data in these fields:
Rising-Enter the rising threshold value, a standard Remote Monitoring (RMON) type hysteresis mechanism, in milliseconds. When the actual response time exceeds the rising threshold, the collector uses the values specified in the Reaction Type field to calculate whether a threshold violation occurred. When a threshold violation occurs, as defined by the Reaction Type, the action defined in the Action Type field is executed. Valid values are 0 through 2147483647 milliseconds. The default value is 5000 milliseconds.
Falling--Enter the falling threshold value (a standard RMON-type hysteresis mechanism), in milliseconds. When the actual response time drops below the falling threshold, the collector uses the value specified in the Reaction Type field to calculate whether a threshold violation occurred. When a threshold violation occurs, as defined by the Reaction Type, the action defined in the Action Type field is executed. Valid values are 0 through 2147483647 milliseconds. The default value is 3000 milliseconds.
Reaction Type--Select the method that specifies how IPM will calculate whether to execute an action. When the actual response time on this collector exceeds the rising threshold or drops below the falling threshold, IPM uses this method to determine whether the rising or falling thresholds have been violated. If IPM determines that a threshold was violated, it executes the action defined in the Action Type field. The possible methods of calculating threshold violations are listed below:
Count1--Enter a value in this field that will be substituted for the Count1 value in one of these Reaction Types: consecutive, xOfy, or average. Valid values are 1 through 16. The default value is 5.
Count2--Enter a value in this field that will be substituted for the Count2 value in the xOfy Reaction Type. Valid values are 1 through 16. The default value is 5.
TimeOut--If you select the TimeOut parameter, the defined Action Type is executed whenever a timeout occurs on this collector.
Disconnect--If you select the Disconnect parameter, the defined Action Type is executed whenever a disconnection (loss of connection) occurs on this collector. This option is used only for SNA connection-oriented protocols.
Action Type--Select the action, or actions, the collector performs when one of these occurs:
Step 3 Click OK.
You can specify when the collector is to be activated and how long it will remain configured in the source router while inactive. To schedule a collector, follow these steps:
Step 1 Click Schedule on the IPM-Add Collector window (Figure 4-10). The IPM-Schedule Collector window is displayed, as shown in Figure 4-13.
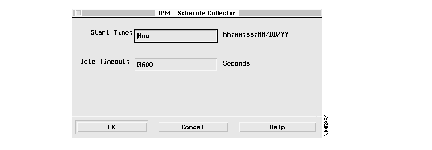
Step 2 Enter data in these fields:
Start Time--Enter the time at which the collector is to start collecting information. The possible values are as follows:
Idle Timeout--Enter the number of seconds to keep the collector, and any data it collects, resident at the source router when the collector is not actively collecting response-time data. Time spent actively collecting data is not counted against the collector's idle timeout. Whenever the collector is active, the idle timeout is reset to allow the collector to continue to exist. Idle timeout starts when the collector is defined in the source router. It is reset and stopped when the collector becomes active. When the collector has finished and is no longer active, the idle timeout is restarted.
If you set the idle timeout to 0, the collector never ages out. It remains in the source router even when not collecting data, which can impose an undue burden at the router.
Valid values are 0 through 2073600 seconds (576 hours). The default is 3600 seconds (1 hour).
Step 3 Click OK.
You can cancel an active collector. An active collector is a collector that has been configured and that has an end time and date that are later than the current time and date. When you cancel a collector, the collector becomes inactive and does not collect data. To cancel an existing IPM collector, follow these steps:
Step 1 From the Internetwork Performance Monitor main window (Figure 4-1), select an active collector from the list displayed.
Step 2 From the menu bar, select Edit>Cancel Collector.
Step 3 When the confirmation box appears, click Yes.
You can copy collector definitions for collectors that you want to reuse. You must specify a new collector name and a start time. All other properties of the collector definition are copied. To copy a IPM collector, follow these steps:
Step 1 From the Internetwork Performance Monitor main window (Figure 4-1), select a collector from the list displayed.
Step 2 From the menu bar, select Edit>Copy Collector. The Copy Collector window is displayed.
Step 3 Enter data in these fields:
Collector Name--Enter a symbolic name that you want to assign to this collector. This is the name that will appear in the Collector field on the Internetwork Performance Monitor main window. Each collector name must be unique in the IPM database. This name can be from 1 to 32 characters; do not include special characters such as ! @ # $ % ^ & * ' '' or | in this name.
Start Time--Enter the time at which the collector is to start collecting information. The time should be in the following format:
Step 4 Click OK.
You can delete collectors that you no longer need. When you delete a collector, all data related to that collector is removed from the database. If the selected collector is active, IPM first cancels the collector, and then deletes it. To delete an IPM collector, follow these steps:
Step 1 From the Internetwork Performance Monitor main window (Figure 4-1), select a collector from the list displayed.
Step 2 From the menu bar, select Edit>Delete Collector.
Step 3 When the confirmation box appears, click Yes.
To view the status of the SNMP server and data collector server components, select Admin>IPM Status from the Internetwork Performance Monitor main window (Figure 4-1). The IPM Application Status window is displayed, as shown in Figure 4-14.

This window tells you the status of IPM components.
The Internetwork Performance Monitor main window, as shown in Figure 4-15, displays all the collectors you have added. Any collectors that have end dates and times later than the current date and time are considered active collectors.

To view the details of any of the active collectors displayed on this window, perform these steps:
Step 1 From the Internetwork Performance Monitor main window (Figure 4-1), select an active collector.
Step 2 From the menu bar, select View>Collector Details. The IPM-Collector Details window is displayed, as shown in Figure 4-16.
To update the collector status, select View>Refresh.
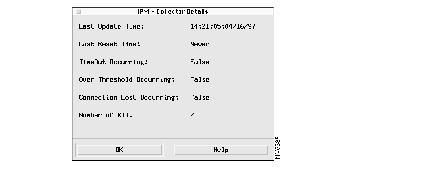
The following information is displayed:
Last Update Time--The time and date when the selected collector was created.
Last Reset Time--The date and time when the selected collector was last reset.
TimeOut Occurring--Indicates whether a TimeOut is occurring:
Over Threshold Occurring--Indicates whether an over threshold condition is occurring:
Connection Lost Occurring--Whether a connection loss is occurring:
Number of RTT--The number of round-trip time measurements made by this collector.
You can view the properties of the source router associated with any of the collectors displayed on this window. To view the properties of a source router, perform these steps:
Step 1 From the Internetwork Performance Monitor main window (Figure 4-1), select the collector whose source properties you want to view.
Step 2 From the menu bar, select Properties>Source. The Source Properties window is displayed, as shown in Figure 4-17.

The following information is displayed:
Number of IPM Entries--The maximum number of collectors that can be supported by this source router.
Last Time Set--The last time the source router's RTTMON MIB configuration was changed.
Maximum Packet Data Size--The maximum packet size, in bytes, that can be supported by this source router.
Version--The version of the RTTMON MIB being used.
Step 3 Click OK to return to the IPM main window.
As your collectors begin to collect response time information and the information is stored in the database, you can view the resulting statistical data. You can view the response-time results from any of the collectors listed on the IPM main window and see whether that collector is active or inactive.
To view the results, follow these steps:
Step 1 From the Internetwork Performance Monitor main window (Figure 4-1), select the collector to be viewed.
Step 2 From the menu bar, select View>Display Results. The IPM-Display Response Time Results window is displayed, as shown in Figure 4-18.

In this window, select the starting and ending time for the statistics you want to view. These times relate to when the statistics are gathered by the collector, not when you want to view them. When this window is displayed, it already contains the starting and ending times for the collector, so you can just press Enter to view statistics for that time period. After you select the starting and ending times, click OK to view the results.
Start Time--Specify the starting time for the response-time statistics you want to view. This marks the earliest statistics you want to view. For example, although your collector collected statistics from 10:00 to 23:00, you may be interested in only those gathered from 11:00 to 13:00. In this case, you would indicate 11:00 as the start time.
You can specify the Start Time in one of these ways:
End Time--Enter the ending time (the latest statistics) for the response-time statistics you want to view. For example, although your collector collected statistics from 10:00 to 23:00, you may be interested in only those gathered from 11:00 to 13:00. In this case, you would indicate 13:00 as the end time.
You can accept the default value and just press Enter.
You can enter an ending time that is later than the time when the selected collector stopped gathering statistics, but the displayed statistics stop when the collector stopped. For example, if you enter an ending time of 12:00:00:10/24/96, but the collector stopped collecting data at 11:00:00:10/24/96, the displayed statistics will include data only up to 11:00:00:10/24/96.
Step 3 Click OK. The IPM-Display window is displayed. No data is displayed yet, but the window shows you the paths found from the source to the target. Each icon in the upper-left corner of this window represents a different path.
Step 4 Select one of the path icons to see all the hops for that path, and then select one of the hops. The response-time statistics for that hop are displayed, as shown in Figure 4-19.
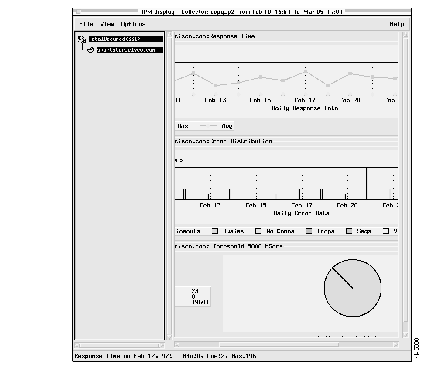
This section describes the parts of the IPM-Display window and how to use them.
The path area, on the left side of the IPM-Display window (see Figure 4-19), displays icons that represent the source router, any intermediate routers, and the target for the selected collector. The pattern of icons displayed depends on the operation configured for this collector.
In each path, there are two kinds of icons:
When you first display results for a collector, the path area shows just the list of paths monitored by that collector, as shown in Figure 4-20.

Each "A-B" path icon represents a different path from the source to the target. If you select an "A-B" path icon, that path is expanded to show its hops, as shown in Figure 4-21.
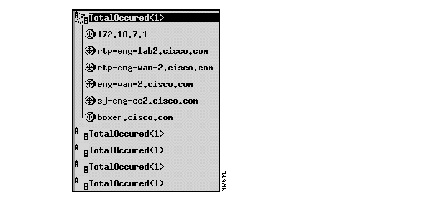
Each hop icon in the selected path is displayed with the IP address or host name of the device at that hop. When you then select one of the hop icons, the statistics area displays the response-time statistics from the source to that hop.
When you select the last hop icon in the path, the statistics area displays the end-to-end response-time data from the source to that target.
The right side of the IPM-Display window is the statistics area. It displays a column of three graphs, as shown in Figure 4-22, for the hop you select in the path area.
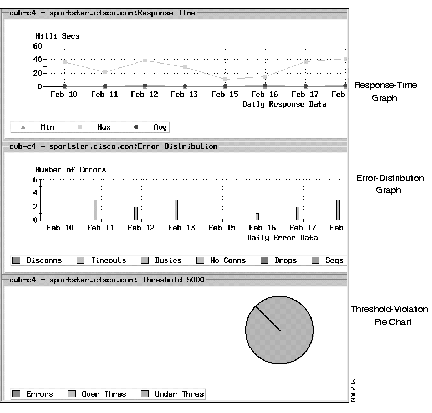
The statistics area displays the following:
If the duration of the collector is more than 24 hours, the data in the Response-Time graph and the Error-Distribution graph will be displayed in daily increments. To view the hourly data for a specific date, click one of the dates shown on the bottom axis of the graph. To return to the graph of daily data, from the View menu, select Up.
This graph displays the trend of response times gathered by the collector for the hop you select in the path area. The vertical axis of the graph shows response time, in milliseconds. The horizontal axis shows the time that the collector was active, in hours.
This graph can display the following statistics:
This graph displays the trend of error statistics gathered by the collector for the hop you select in the path area. The vertical axis of the graph shows the number of errors found. The horizontal axis shows the time the collector was active, in days or hours.
This graph can display the following statistics:
This pie chart displays the trend of threshold-violation statistics gathered by the collector for the hop you select in the path area.
The chart shows the distribution of threshold violations that you defined in the IPM-Configure Events & Thresholds window (Figure 4-12). The segments shown in this chart are as follows:
The information that is shown in the IPM-Display window is static information from the database. The database is updated on an hourly basis; new information about the paths is taken and response times are measured. If you believe that new information might have become available in the database since you opened the IPM-Display window, you can get updated information by selecting Refresh paths from the Options menu.
For active collectors, you can view the response-time data as it is being retrieved from the collector on the source router. This data is not stored in the database until the hourly collection is performed.
To view this data:
Step 1 From the IPM-Display window (Figure 4-19), select a hop.
Step 2 From the menu bar, select View>Go Live. The IPM Go Live window is displayed, as shown in Figure 4-23.
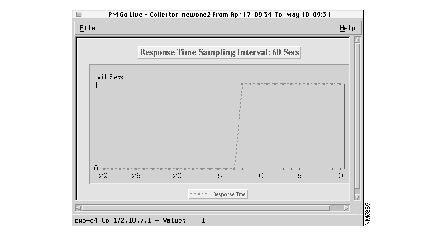
This window is updated on an interval equal to the interval of the collector. You can view live data for only one hop at a time.
You can print the data for each of the graphs in the IPM-Display window. To print the data of an a IPM graph, follow these steps:
Step 1 From the IPM-Display window (Figure 4-19), select File>Print. A submenu is displayed.
Step 2 Select the graph that you want to print (Response Time, Error Distribution, or Threshold). The Print window is displayed.
Step 3 Enter data in these fields:
Destination--Specify whether the data is to be printed to a printer or saved to a file. If printing to a printer, specify the name of the printer. If saving to a file, specify the directory and filename.
Format--Specify whether the data should be in PostScript or XWD.
If you want to alter the print settings, click Properties. The Print properties window is displayed, allowing you to change settings such as the paper size.
Step 4 Click Print.
When you have finished configuring collectors or viewing response-time statistics, you can exit IPM by following these steps:
Step 1 From the Internetwork Performance Monitor main window (shown in Figure 4-1), select File>Exit. A confirmation window is displayed, as shown in Figure 4-24.

Step 2 Select "Shutdown only GUI Application(s)" to close the IPM interface, or select "Shutdown complete IPM Application" to close the entire IPM application. Active collectors will continue to run.
Step 3 Click OK.
|
|