|
|

Protocol Decode lets you examine previously captured data packets that are stored in a file that you define. You have two options when you use Protocol Decode:
You use the Protocol Decode function when you want to see the contents of individual data packets. You specify how you want the data decoded and displayed. You can also limit the amount and type of data displayed by specifying a filter to either pass or reject captured data frames that match its pattern.
Before you can use Protocol Decode, you must first use Data Capture to capture packets selectively from an RMON agent and save them in a file. You can capture the traffic you want for either standard or user-defined protocols. Once you have captured the data you want to examine, you can analyze it using the Protocol Decode tool. To set up a data capture session, use the following procedure.
Step 1 If you have not already done so, log in to the network management station where TrafficDirector is installed, and run the TrafficDirector application.
Step 2 Select an agent from the Agent list in the TrafficDirector main window and click the Data Capture icon, or select Application>Data Capture from the menu bar. The Data Capture window is displayed (Figure 7-1), with the agent name shown at the top of the window.
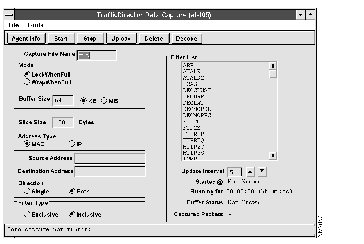
Enter the information in the appropriate fields in the Data Capture window. Each field is described below:
| Captured File Name | Determines the name of the file where packets from the agent are uploaded. This file is stored in the c:\traffdir directory. The name is case sensitive. The default file name is tmp.dat. (TrafficDirector supplies the .dat extension for you.) |
| Mode | Determines whether the session stops when the capture buffer is full. Lock When Full stops the session when the capture buffer is full. Wrap When Full lets the capture session continue when the buffer is full, with the most recent packets overwriting the earliest, until you click the Stop button. The default mode is Lock When Full. |
| Buffer Size | Determines the maximum number of bytes to be saved in this capture buffer, including any implementation- specific overhead. Select either KB or MB. The range is from 32 to 8192 KB or 1 to 8 MB. The value must be a decimal number. The default buffer size is 64 KB. |
| Slice Size | Determines the maximum number of bytes of each packet that are saved in the capture buffer. For example, if a 1500-byte packet is received and Slice Size is set to 500, then only the first 500 bytes of the packet are stored in the associated capture buffer. The range is from 0 to 1518 bytes. If you set Slice Size to 0, the capture buffer saves the entire packet. The value must be a decimal number. The default slice size is 128 bytes. |
| Address Type | Determines the address type as either MAC or IP. The address or symbol entered at Source Address and Destination Address is interpreted on this basis. The default address type is MAC. |
| Source/Destination Address (two fields) | Determines the source and destination addresses. Valid MAC address, valid IP address, or valid Name are allowed. TrafficDirector uses these addresses to create more specific filters related to the source/destination of the data to be captured.
MAC addresses are in this format: IP addresses must be dotted IP notation (for example: Name must be a valid host name. |
| Direction | Determines whether to capture traffic from source-to-destination only (Single) or in both directions (Both), which is the default. |
| Filter Type | Determines data capture properties: Inclusive (default) or Exclusive.
Inclusive captures all traffic when specified conditions (such as Address Type, Source Address, and Destination Address) match. Exclusive captures all traffic when the specified conditions do not match. |
| Update Interval | Determines the duration, in seconds, of the time between status field (described below) updates. The value must be a decimal integer.
The minimum (default) value is 5 seconds. The maximum value is 99 seconds. |
| Filter List | Determines one or more filters from this list. Remember that the Filter Type field determines whether the filters you select are exclusive or inclusive.
If multiple filter types are selected, and Inclusive is selected, they are automatically included in the capture using the "OR" logical operator. If multiple filter types are selected, and Exclusive is selected, they are automatically excluded from the capture using the "AND" logical operator. Filter types not selected are included. |
TrafficDirector updates the following status fields while you are running Data Capture:
| Started @ | Displays the date and time when the packet capture function started. |
| Buffer Status | Determines if capture is already on, Buffer Status displays "Running" and the time the capture was started. If capture is stopped, it displays "Stopped." If a capture entry does not exist, this field displays "Not Known." It also shows buffer status in brackets ("Full" or "Available"). |
| Captured Packets | Determines the number of packets captured in the agent with the matched condition. This field is periodically updated during the capture sequence. |
Step 4 Click Start. This initiates an SNMP session that instructs the selected agent to begin collecting packets according to the filter definition.
Step 5 Click Stop to end the Data Capture session. The captured data is stored in a buffer in the agent. If you selected the mode Lock When Full, the data capture function stops automatically when the buffer becomes full.
Step 6 Click Upload to transfer the captured data from a buffer in the agent to the file you have specified in the Captured File Name field. The default file is tmp.dat.
When the upload process begins, a status report showing the number of packets uploaded is displayed in the lower margin of the window.
Step 7 When you have uploaded the data and you want to decode it, select Protocol Decode from the TrafficDirector window, or click the Decode button in the Data Capture window to initiate protocol decode.
You may want to stop a data capture session and clear the buffer. To do so, click the Delete button.
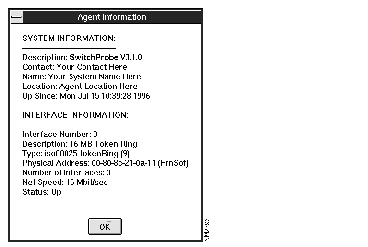
To get a description of the agent you are using for data capture, use the following procedure.
Step 1 Select Tools>Agent Info from the menu bar. The Agent Information window is displayed (Figure 7-2).
Step 2 Click OK to close the window.
To exit the Data Capture window, select File>Exit from the menu bar.
Once you have captured data into a file, you can decode it, one frame at a time. In this section, you learn how to use Protocol Decode to examine captured data.
To see individual frames using Protocol Decode, use the following procedure.
Step 1 Click the Protocol Decode icon from the TrafficDirector main window. The Protocol Decode window is displayed (Figure 7-3).
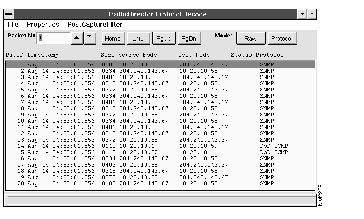
Step 2 Load the data capture file you want to examine (see "Loading a Data Capture File" later in this section). The data is displayed in the Protocol Decode list. Each line is one frame.
Step 3 Select the frame you want to decode.
Step 4 Using the Properties menu, determine how you want the data to be decoded (see the "Selecting Protocol Decode Properties" section later in this chapter).
Step 5 If needed, select Post-Capture Filtering for additional filtering. See the "Filtering Previously Captured Data Using Post-Capture Filters" section later in this chapter.
Step 6 Perform protocol decode in either Raw mode or Summary mode as described in the "Viewing Decoded Data in Raw Byte Form" section later in this chapter.
Before you can perform a protocol decode, you must load the captured data file. To do so, use the following procedure.
Step 1 Select File>Load from the menu bar in the Protocol Decode window. The Select File window is displayed (Figure 7-4).
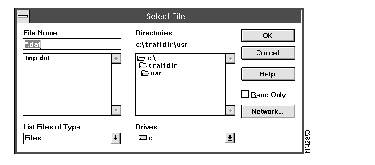
Step 2 Select the directory and file that contains the captured data you want to decode from the list. Use the directory filter to help you select files. To use the filter, enter a directory path and file filter, such as *.dat, then select Filter. Note that the data is stored in a file named xxx.dat.
Step 3 Click OK to load the data capture file. The file information is displayed in the list in the Protocol Decode window. It is listed by frame number.
Before you decode a frame, you can modify four properties that determine how decoded data in each mode is displayed. To determine protocol decode properties, select the Properties menu in the main Protocol Decode window. The Properties window is displayed (Figure 7-5).
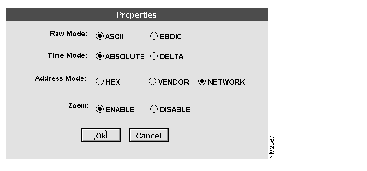
The selection fields specify the protocol decode properties. These fields contain toggle buttons that you can click to indicate your preferences. Make your selection for each field, then click Apply to put your selections into effect or Cancel to cancel the selections and return to the previous window. Each field is described as follows:
| Raw Mode | Determines whether the decoded bytes are displayed as ASCII or EBCDIC characters. The default is ASCII. |
| Time Mode | Determines whether the time displayed is the default value, Absolute (in mm.dd.hh.min.secs.msecs format), or Delta (in hh.min.sec.msec format), the difference between arrival of the current and previous frames. |
| Address Mode | Sets the Source/Destination address display as Hex, Vendor, or Network (IP). The default is Network. |
| Zoom Mode | Enables and disables the multipaneled, multicolor effect in the seven-layer Protocol Decode window (see the "Performing Protocol Decode" section). Default is Enable. |
There are four ways you can view a data capture file:
| Summary Mode | The complete file is displayed in the Protocol Decode window list when you load it. Each line represents a frame of captured data. It has not yet been decoded. |
| Raw Mode | A single frame you select is decoded and presented in raw byte form. |
| Protocol Decode mode | A single frame you select is decoded and presented in full seven-level format. |
| Zoom Mode | Any of the seven layers, as appropriate for the packet being decoded, can be displayed in the full window. |
Before you perform a protocol decode, the file you selected is displayed in summary mode in the list in the Protocol Decode window. Each frame is represented by a single line numbered from 1 to n, where n is the total count of frames in the capture buffer, as shown in Figure 7-3.
The summary mode list contains a number of headings with values shown below. The summary mode list information includes:
| Pkt ID | The index number of the frame, starting with 1. You can scroll through the list of frames by using the cursor. The frame currently selected is highlighted. |
| Timestamp | The timestamp indicating the date and time this frame was captured. The format of the timestamp is Month Day hh:mm:ss:ttt. For example: Dec 7 17:32:25.569
|
| Size | The number of bytes in the frame. |
| Source Node | The address of the node that sent that frame. However, if Vendor Name is the default, the name of the node is displayed instead. |
| Destination Node | The address of the destination node specified in the frame. However, if Vendor Name is the default, the name of the vendor is displayed instead. |
| Status | If a frame is faulty, the type of fault (more than one may apply):
· R indicates a runt frame (a frame less than 12 bytes long). · J indicates a jabber frame (a frame more than 1518 bytes long). · C indicates a CRC/alignment error frame. · P indicates a processing error. For example, Frame 40 with a processing error indicates that the agent was not able to process packets just prior to capturing Frame 40. · --> indicates a packet from DTE to DCE (WAN only). · <-- indicates a packet from DCE to DTE (WAN only). |
| Protocol | Identifies the highest-level protocol in that frame. |
The selection buttons in the Protocol Decode window (Summary Mode) let you specify the parameters for the decoding function. The selections buttons include:
| Change Mode | Toggles Protocol Mode and Raw Mode. |
| GoTo Packet | Shows the first frame on the first line (Home) or the last frame on the last line (End). Selecting either initiates the action. You can use the scroll arrows to scroll either forward or backward through the frames. |
| Packet Number | Displays a specific frame, based on the frame number entered. |
Raw mode presents decoded data in raw byte form. To view protocol information in raw mode, select Raw in the Change Mode field in the main Protocol Decode window. The Raw Decode window is displayed (Figure 7-6). Note that the name and path of the capture file is displayed at the bottom of the window. The list headings include Frame Number, Size, Arrival Time, and display mode (ASCII or EBCDIC).
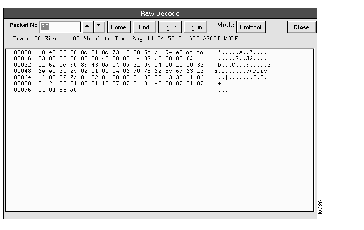
The buttons in the Raw Decode window let you specify the parameters for the following decoding functions:
| Change Mode | Switches to Protocol Mode. |
| GoTo Packet | Moves immediately to either the first frame displayed in the list (Home) or the last (End). |
| Packet Number | Displays a specific frame in the list. Inserting a packet number in the Frame Number field displays the raw decode of that frame. Use the up and down arrows in the Frame Number field to scroll the display up or down one frame at a time. |
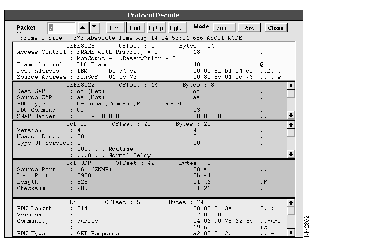
Selecting Protocol in the Change Mode field of either the Protocol Decode window or the Raw Decode window displays the highlighted frame in seven-level, decoded format. The decoding is fully automatic and causes the frame to display up to seven lists, with each corresponding to successive layers of the protocol (Figure 7-7).
Use the scroll bars on the list to scroll through each protocol layer and examine the contents of each layer (of the OSI seven-layer model) shown in readable format. If the frame contains no identifiable protocol after a certain layer, the rest of the frame is displayed as a raw dump in the last list, labelled User Data.
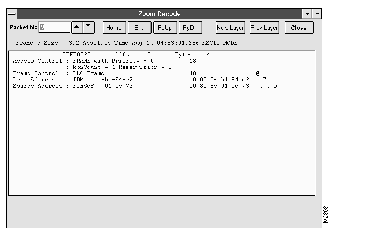
Select Zoom using the Change Mode button in the Protocol Decode window to see a full display of any protocol layer contained in the current frame as displayed in the Zoom Decode window (Figure 7-8). The Zoom Decode window lets you scroll back and forth through protocol layers by clicking the Next Layer or Prev Layer buttons. The display wraps from the highest layer back to the lowest layer decode and vice versa.
You can see new frames by using any of the techniques described earlier to scroll through the frames displayed in the Summary Mode window.
Sometimes you may want to filter previously captured data to isolate protocol information you need. You can do this using the Post-Capture Filters. The following procedure steps you through the process.
Step 1 Load the data capture file, as described in the "Loading a Data Capture File" section earlier in this chapter.
Step 2 Select Post-Capture Filtering from the Protocol Decode window. The Post-Capture Filters window is displayed (Figure 7-9).
Step 3 Select the filter definition you want to use.
Step 4 Click Apply. The Summary Mode list in the Protocol Decode window now contains only packets that have passed your Post-Capture Filter definition.
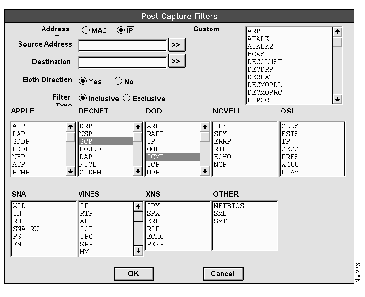
The selection fields simplify specification of the parameters for post-capture filtering. These fields contain toggle buttons to indicate your preferences. The selections include:
| Address Type | You can specify the address type as either MAC or IP. The address or symbol entered in the Source Address and Destination Address fields are interpreted according to this setting. You can select any valid MAC address, IP address, or name. Use these addresses to create more specific filters related to the source or destination of the data to be captured. |
| Source/Destination Address | Select Source Address or Destination Address to specify source and destination addresses for filtering. |
| Both Directions | Determines whether to capture traffic from source-to-destination only or in both directions. Click Yes to filter data in both directions; click No to filter data in only one direction. |
| Filter Type | Can be either inclusive or exclusive. Inclusive captures all traffic if the specified condition is matched. Exclusive captures all traffic that does not meet the specified condition. |
|
|