|
|

This chapter allows you to customize the way your LightStream 2020 multiservice ATM switch (LS2020 switch) displays and logs traps. The procedures in this chapter provide significant flexibility in trap management. For example, you can
Figure 2-1, Figure 2-2, and Figure 2-3 show how traps flow through an LS2020 node. These illustrations also show the CLI commands that you can use to affect trap flow. Each CLI command is explained in greater detail in this chapter.
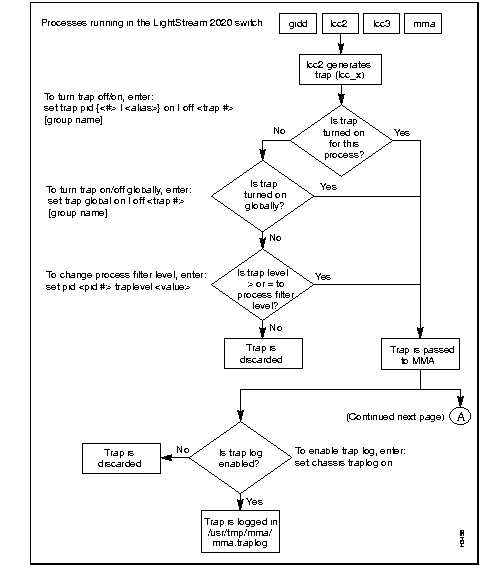
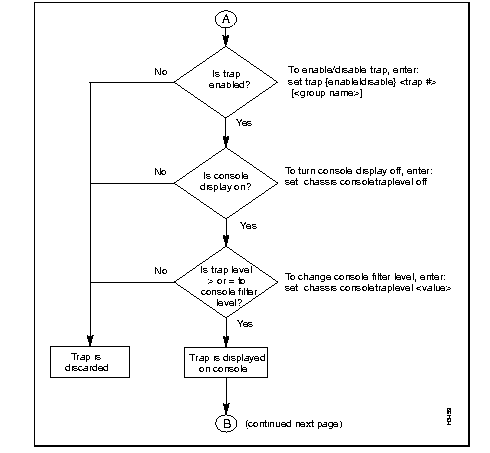
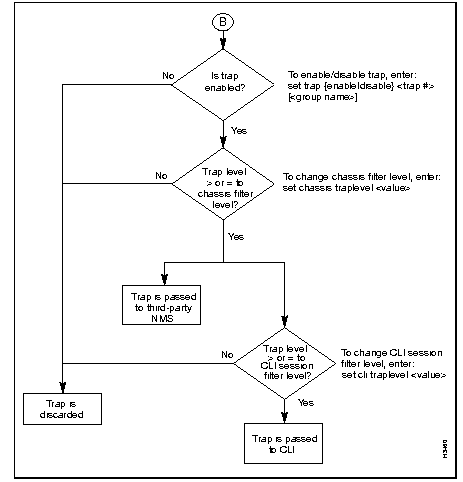
You can determine which traps are to be displayed by setting the trap reporting threshold (also called the trap level). There are four settings for the trap reporting threshold: operational (oper), informational (info), trace, and debug.
Table 2-1 shows the effect of setting the trap reporting threshold at different levels. As indicated in the table, if you enable a certain trap level, traps at and above that priority level are reported. For example, if you set the trap reporting threshold to trace, trace traps and all higher priority traps (informational and operational) will be reported, while debug traps will not be reported.
|
Trap Reporting Threshold | Trap Type | ||||
|---|---|---|---|---|---|
OPER | INFO | TRACE | DEBUG | SNMP | |
Operational Informational Trace Debug | x | x | |||
| x | x | x | |||
| x | x | x | x | ||
| x | x | x | x | x | |
Figure 2-4 identifies the paths in an LS2020 system where you can set the trap reporting threshold. By setting the trap reporting threshold at a particular trap filter, you can prevent traps from being passed to the next process. As shown in Figure 2-4, you can establish filter traps for the following LS2020 entities:
In effect, setting a trap reporting threshold creates a trap filter that either passes the trap to the next process in the system or drops the trap altogether. At each trap filter, you can set the trap reporting threshold (the trap level) to the operational, informational, trace, or debug state.

The following sections describe how you can change the trap reporting threshold for processes, the LS2020 chassis, a CLI session, or the local console to suit your particular operating requirements. Note, however, that the default settings for these LS2020 entities are appropriate for most networks.
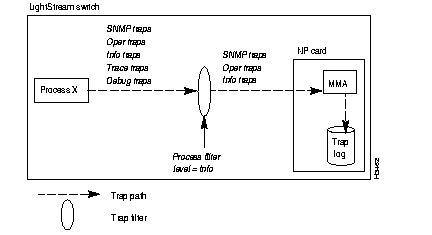
Setting the trap reporting threshold for a particular process determines which traps generated by that process will be passed to the MMA. Traps that are passed from the processes into the MMA are, by default, logged in the trap log. The default trap reporting threshold for all processes is informational. This level is appropriate for most applications. (Note that the console port transmits all traps that are recorded in the trap log.)
Traps of all priority levels are generated by the software process. However, only SNMP, operational, and informational traps are passed to the MMA. Figure 2-5 shows trap processing when a process filter is set to the informational (default) state.
To set the trap reporting threshold for processes, perform the following steps:
Step 1 Verify that the target switch is correct by entering the following at the cli> prompt:
show chassis general
If you need to change the target switch, refer to the LightStream 2020 Network Operations Guide for instructions.
Step 2 Set the SNMP community to a read/write community by entering the following at the cli> prompt:
set snmp community <community name>
where:
<community name> = The SNMP read/write community that you want to access.
Step 3 Enter the following at the cli> prompt to display a list of the processes:
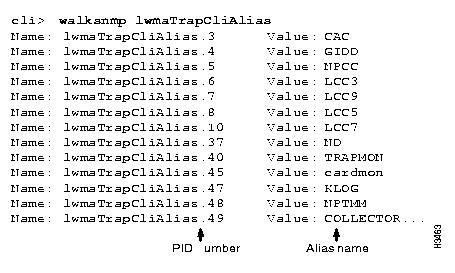
This command lists the PID (process identification) numbers and alias names of all the processes running on this LS2020 switch. The PID numbers follow the Name: lwmaTrapCliAlias fields, and the alias names follow the Value fields, as shown in the sample display in Figure 2-6.
Select the process(es) you want from the list in the display.
Step 4 To set the trap reporting threshold for a selected process, enter the following at the cli> prompt:
set pid {<#>|<alias>} traplevel <value>
where:
{<#>|<alias>} = The process number or alias name.
<value> = oper
info (default)
trace
debug
Step 5 Verify the process trap reporting threshold by entering the following at the cli> prompt:
As a consequence of this procedure, the trap reporting threshold for the specified process filter is changed to the specified level. Subsequently, all traps at that level (and higher) are passed from the process to the MMA.
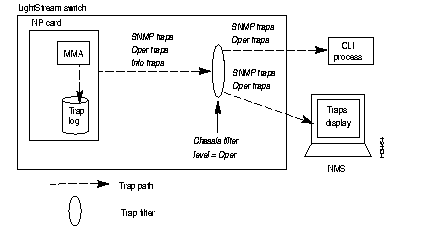
The trap reporting threshold for the chassis determines which traps are passed from the MMA to the CLI process and the NMS. The default trap reporting threshold for the chassis is operational. This setting is appropriate for most networks.
Figure 2-7 shows trap processing when the chassis filter is set to the operational default and the process filter is set to the informational default. Although SNMP, operational, and informational traps are received by the MMA, only SNMP and operational traps are passed to the CLI process and the NMS because the chassis filter is set to operational.
To temporarily change the configured setting for the chassis trap reporting threshold, perform the following steps:
Step 1 Verify that the target switch is correct by entering the following at the cli> prompt:
show chassis general
If you need instructions on changing the target switch, refer to the LightStream 2020 Network Operations Guide.
Step 2 Set the SNMP community to a read/write community by entering the following at the cli> prompt:
set snmp community <community name>
where:
<community name> = The SNMP read/write community that you want to access.
Step 3 Set the trap reporting threshold for the chassis filter by entering the following at the cli> prompt:
set chassis traplevel <trap value>
where:
<value> = oper (default)
info
trace
debug
Step 4 Verify that the trap reporting threshold has been changed by entering the following at the cli> prompt:
show chassis agent
As a consequence of this procedure, the trap reporting threshold for the chassis filter is changed to the specified level. Subsequently, all traps at that level (and higher) are sent to the CLI and the NMS.
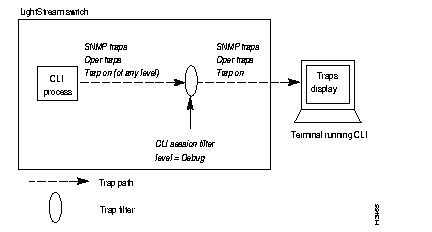
The trap reporting threshold setting for the CLI session determines which traps are displayed by the terminal running the CLI session. The default trap reporting threshold for the CLI is debug. This level is appropriate for most applications.
Figure 2-8 shows trap processing when the CLI session filter is set to the debug default and the process and chassis filters are likewise set to their default states.
All traps reported to the MMA are displayed in the CLI. Setting the default to debug ensures that any trap (regardless of its level) is displayed in the CLI. This is important because you can override the filter setting for an individual trap (by turning it on) using the procedure later in this chapter entitled "Managing Individual Traps."
To set the trap reporting threshold for a CLI session, perform the following steps:
Step 1 Verify that the target switch is correct by entering the following at the cli> prompt:
show chassis general
If you need instructions on changing the target switch, refer to the LightStream 2020 Network Operations Guide.
Step 2 Enter the following at the cli> prompt to set the trap reporting threshold for the CLI:
set cli traplevel <value>
where:
<value> = off -- displays no traps
oper
info
trace
debug (default)
Step 3 Verify that the trap reporting threshold for the CLI has been changed by entering the following at the cli> prompt:
show cli traplevel
After you perform this procedure, the trap reporting threshold for the CLI session filter is changed to the specified level. Subsequently, all traps at that level (and higher) are displayed by the CLI.
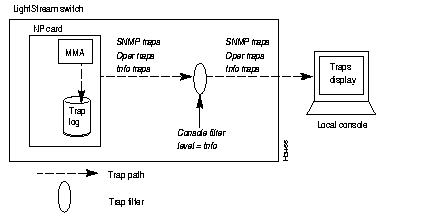
The trap reporting threshold setting for the console filter in each LS2020 switch determines which traps are displayed on the local console (if the LS2020 node has a local console). By default, traps are displayed automatically whenever a console is started up. The default trap reporting threshold for the console filter is informational. This level is appropriate for most applications. (Note that the console port transmits all traps that are recorded in the trap log; disabling individual traps does not prevent them from being displayed on the console.)
Figure 2-9 shows trap processing when the console filter is set to the informational default and the process filter is likewise set to its informational default state. Under these conditions, all SNMP, operational, and informational traps passed to the MMA are displayed on the local console.
To set the trap reporting threshold for the local console, perform the following steps:
Step 1 Verify that the target switch is correct by entering the following at the cli> prompt:
show chassis general
If you need instructions on changing the target switch, refer to the LightStream 2020 Network Operations Guide.
Step 2 Set the SNMP community to a read/write community by entering the following at the cli> prompt:
set snmp community <community name>
where:
<community name> = The SNMP read/write community that you want to access.
Step 3 Set the trap reporting threshold for the console or turn off the console display by entering the following at the cli> prompt:
set chassis consoletraplevel <value>
where:
<value> = off -- displays no traps
oper
info (default)
trace
debug
Step 4 Verify that the console trap reporting threshold has been changed by entering the following at the cli> prompt:
show chassis general
After performing this procedure, the trap reporting threshold for the console is changed to the specified level. Subsequently, all traps at that level (and higher) are displayed by the console.
In an LS2020 network, you can view traps in three places:
On the LS2020 console or in the CLI, traps are displayed in the format described in the section "Types of Traps" in the chapter entitled "About LightStream 2020 Traps." Trap messages may be interleaved with other information displayed by the CLI, depending on how your system is set up. Figure 2-10 shows a typical CLI display that incorporates a trap message.
If you use an NMS, the message format may vary from the format described earlier, but the content will be identical.

You can log the traps that occur on each LS2020 switch. The traps are stored on the NP of the switch in a file called mma.traplog in the /usr/tmp/mma directory. This circular file can store approximately 6000 traps before the oldest trap is overwritten by the latest trap. Which traps are logged is determined by the trap reporting thresholds set for each process. This section tells you how to enable or disable the trap log.
You can enable or disable the trap log for a particular LS2020 switch. Traps cannot be logged unless the trap log is enabled.
The default setting for the trap log is enabled (on). This setting is appropriate for most networks.
Ordinarily, whether the trap log is enabled or disabled is specified during network configuration. However, if you want to temporarily change the configured setting, you can use the procedure below. (Note, however, that such a change is lost if the system is rebooted.)
If you want to make a permanent change to the trap log status attribute, use the LS-Configurator to edit the configuration and update the appropriate node, as described in the LightStream 2020 Configuration Guide.
If a node's trap log file is moved or deleted, trap logging is effectively disabled. If the file /usr/tmp/mma/mma.traplog is not present, you can use this procedure to re-enable trap logging.
 | Caution If you disable the trap log for a particular switch, you will not have a record of traps reported during a problem condition in the switch. |
To enable or disable the trap log for a particular LS2020 switch, perform the following steps:
Step 1 Verify that the target switch is correct by entering the following at the cli> prompt:
show chassis general
If you need instructions on changing the target switch, refer to the LightStream 2020 Network Operations Guide.
Step 2 Set the SNMP community to a read/write community by entering the following at the cli> prompt:
set snmp community <community name>
where:
<community name> = The SNMP read/write community that you want to access.
Step 3 Enable or disable the trap log for a particular chassis by entering the following at the cli> prompt:
set chassis traplog <value>
where:
<value> = on--enables the trap log (default)
off--disables the trap log
Step 4 Verify that the trap log has been enabled or disabled for a particular LS2020 switch by entering the following at the cli> prompt:
After you perform this procedure, the trap log for the specified chassis is enabled or disabled.
Any traps passed from the software processes to the MMA are recorded in a circular file named /usr/tmp/mma/mma.traplog. This section tells you how to:
If you are working in the LynxOS shell, you can view the trap log file by entering the following at the prompt:
LSnode:2$ cbufpr [-hv] [-all] [-tail] -<number> [-f] [-stat] -<level> /usr/tmp/mma/mma.traplog | more
where:
[h] = Displays a help message. Other arguments with the -h argument are ignored.
[v] = Displays cbufpr version information. Other arguments with the -v argument are ignored (except the -h).
[all] = Allows you to read files of all formats, including files that are not circular.
[tail] = An optional argument that displays the last 20 lines of the file (the lines containing the most recent traps). If you do not enter this argument, the entire file is displayed.
<number> = Specifies the number of lines to display. This switch can be used with the -tail switch to specify the number of lines displayed from the bottom of the file.
[f] = Continues reading from the end of file rather than exiting. The switch allows you to display traps as they accumulate while you are viewing other parts of the file. Enter ^C (CTRL-C) to kill the process.
[stat] = Reports the current position of the write pointer.
<level {snmp | oper | info | trace | debug}> = Reports traps at and above the indicated level.
| more = Displays one page at a time. Press the space bar to display the next page. If you do not use | more, the file will scroll across the screen.
For more information on the cbufpr command, refer to the LightStream 2020 NP O/S Reference Manual.
If you are working in the CLI, you can view the trap log by entering the following at the CLI prompt:
cli> show file traplog
You can use the optional -tail argument with the show file command to display the last 20 (or so) lines of the traplog file. For more information on the show file command, refer to the LightStream 2020 CLI Reference Manual.
If you are working in the CLI, you can use the following procedure to move the trap log to another NP for viewing on that system. If you are working in the LynxOS shell, note that you can just use the ftp command.
To move the trap log file to another NP for viewing, perform the following steps:
Step 1 To set CLI protected mode (required to execute the shell command), enter the following at the cli> prompt:
protected
Step 2 Enter the protected mode password at the following prompt:
Step 3 To unwind the circular log file, enter the following at the *cli> prompt:
shell "cbufpr /usr/tmp/mma/mma.traplog/tmp/traplog"
The traplog file is a temporary file.
Step 4 At the *cli> prompt, enter the following:
shell "ftp <IP address of destination workstation or host>"
You are then prompted to log in to the workstation or host.
Step 5 Log in to the workstation or host.
Step 6 To place the trap log file in any directory other than the login directory on the workstation or host, enter cd <directory name> to change to the appropriate working directory.
Step 7 Enter the following at the ftp> prompt:
put /tmp/traplog [<new name>]
where:
[<new name>] = The file name identifying the chassis or the appropriate directory name for the file. For example, if you are moving a trap log for a switch called Light5, the new name could be mma_Light5.traplog.
This command sends the log file to the specified workstation or host. The system tells you when the file transfer is complete.
Step 8 Enter the following at the ftp> prompt:
ftp> quit
Use any more or cat command or a screen editor such as emacs or vi to view the mma.traplog file on the workstation or host.
Step 9 To remove the temporary traplog file, enter the following:
*cli> shell "rm /tmp/traplog"
Figure 2-11 shows an example of a trap log. Traps without a switch name have been generated by the local node. Traps that include a switch name have been generated by another LS2020 node and reported to the local node.

You can control the reporting of individual traps. This gives you greater flexibility in choosing which traps are reported. Using the capabilities provided in this regard, you can
These capabilities are especially useful for advanced debugging and troubleshooting by experienced users. However, the commands associated with individual traps must be executed from the CLI in protected mode.
This section tells you how to turn a particular trap on or off in a specific process. Turning a trap on in a particular process allows it to be passed to the MMA, even if it has a severity level below the trap reporting threshold set for the process. This allows you to report a particular trap without reporting all traps at that level. This procedure is especially important during troubleshooting and debugging.
Figure 2-12 shows the effect of turning a trap on when the process filter is set to the informational default.
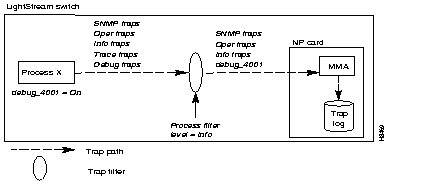
In some cases you may have multiple instances of the same process running. Therefore, you can also turn a trap on globally, affecting the trap in each instance of the process.
The default for all traps in all processes is off. When a trap is set to off, the trap is passed to the MMA only if its severity level is equal to or higher than the trap reporting threshold setting of the process filter.
To turn a trap on or off in a specific process, perform the following steps:
Step 1 At the cli> prompt, enter:
protected
Step 2 Enter the protected mode password when you see the following prompt:
Step 3 Verify that the target switch is correct by entering the following at the cli> prompt:
show chassis general
If you need instructions on changing the target switch, refer to the LightStream 2020 Network Operations Guide.
Step 4 Set the SNMP community to a read/write community by entering the following at the *cli> prompt:
set snmp community <community name>
where:
<community name> = The SNMP read/write community that you want to access.
Step 5 To determine which processes are running on this node, enter the following at the *cli> prompt:
walksnmp lwmaTrapCliAlias
Find the process you want in the resulting list. Figure 2-6 shows the output from this command.
Step 6 Turn a trap on or off as described below.
For a trap in one instance of a process, at the *cli> prompt, enter:
set trap pid{<#|alias>} {on|off} <trap#> [<group name>]
For a trap in multiple instances of a process (globally), at the *cli> prompt, enter:
set trap global {on|off} <trap#> [<group name>]
where:
{<#>|<alias>} = The process number or alias name.
{on|off} Specifies whether the trap is on or off. The default is off.
<trap#> = The trap(s) you want to turn on or off. Enter the symbolic trap name or trap number. You can set multiple trap numbers by specifying the trap numbers (ndd_3 ndd_14 lcc_5), or by using the wild card character "*" to specify all traps for a particular process. If you use *, you must enclose the expression in which it appears with quotes. For example, to specify all NDD traps, you would type show trap "ndd*".
[<group name>] = An optional argument that defines a group of traps. For this argument to be used, the group must be defined in an ASCII file called cli.groups in the /usr/app/base/config directory. Refer to the section "Creating cli.groups File
" later in this chapter for instructions on creating the cli.groups file.
Step 7 To display the status of each trap in the selected process, enter the following at the *cli> prompt:
show trap pid {<#>|<alias>} "*"
At the conclusion of this procedure, the trap(s) that you have turned on pass to the MMA whenever that trap is generated in the selected process. Traps that are turned off pass to the MMA only if they have an equal or higher severity level than the process filter.
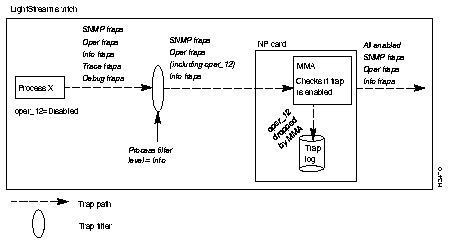
This section tells you how to enable or disable individual traps for all processes, in contrast to the previous procedure, which lets you enable or disable a trap for a particular process. When you disable a trap in an LS2020 switch, the MMA discards it rather than passing it on to the display device. You may want to disable a trap if it recurs frequently and you feel that its display is unnecessary.
Figure 2-13 shows trap processing when traps are enabled (the default case). The MMA checks to see if the trap is enabled or disabled. If the trap is enabled and its severity level is equal to or greater than the CLI session and console filters, the trap is passed to the CLI and the NMS. If the trap is disabled, it is dropped altogether.
To enable or disable a trap for all processes, perform the following steps:
Step 1 At the cli> prompt, enter
protected
Step 2 Enter the protected mode password at the following prompt:
Step 3 Verify that the target switch is correct by entering the following at the *cli> prompt:
show chassis general
If you need instructions on changing the target switch, refer to the LightStream 2020 Network Operations Guide.
Step 4 Set the SNMP community to a read/write community by entering the following at the *cli> prompt:
set snmp community <community name>
where:
<community name> = The SNMP read/write community that you want to access.
Step 5 At the *cli> prompt, enter the following:
set trap {enable|disable} <trap#> [<group name>]
where:
{enable|disable} is an indication of whether the trap is enabled or disabled. The default is enabled.
<trap#> identifies the trap(s) that you want to turn on or off. Enter the symbolic trap name or trap number. You can set multiple trap numbers by specifying the trap numbers (ndd_3 ndd_14 lcc_5), or by using the wild card character * to specify all traps for a particular process. If you use *, you must enclose the expression in which it appears with quotes. For example, to specify all NDD traps, you would type show trap "ndd*"
[<group name>] is an optional argument used to define a group of traps that you want to turn on or off. For this argument to be used, the group must be defined in an ASCII file called cli.groups in the /usr/app/base/config directory. Refer to the section "Creating cli.groups File
" later in this chapter for instructions on creating the cli.groups file.
Step 6 Enter the following at the *cli> prompt to display the status of each trap in the MMA:
show trap "*"
After you perform this procedure, the disabled trap for the selected node is not passed to the CLI nor is it displayed on a third-party NMS. The status display shows traps as either on, off, or disabled. If the status is either on or off, the trap is enabled. Otherwise, the trap is disabled. See the section "Turning Trap On or Off in Specific Process " earlier in this chapter for a more detailed description of trap handling in a specific process.
This section tells you how to view the status of every trap within a particular process or for an MMA. The status display shows traps as either on or off and enabled or disabled. See the section "Turning Trap On or Off in Specific Process " earlier in this chapter for a description of the on/off state. See the section "Enabling/Disabling Trap for All Processes " earlier in this chapter for a description of the enabled/disabled state.
To view the status of one or more traps for a process, perform the following steps:
Step 1 Verify that the target switch is correct by entering the following at the cli> prompt:
show chassis general
If you need instructions on changing the target switch, refer to the LightStream 2020 Network Operations Guide.
Step 2 Set the SNMP community to a read/write community by entering the following at the cli> prompt:
set snmp community <community name>
where:
<community name> = The SNMP read/write community that you want to access.
Step 3 At the cli> prompt, enter the following:
show trap pid {<#>|<alias>} <trap#> [<group name>]
where:
{<#>|<alias>} = The number or the alias name of the process. See the section "Trap Reporting Threshold for Processes" earlier in this chapter for information on obtaining pid numbers and aliases.
<trap#> = The number of the trap(s). Enter the symbolic trap name or trap number. You can set multiple traps by specifying the trap numbers (ndd_3 ndd_14 lcc_5), or by using the wild card character "*" to specify all traps for a particular process. If you use *, you must enclose the expression in which it appears with quotes. For example, to specify all NDD traps, you would type show trap "ndd*".
[<group name>] = An optional argument used to define a group of traps on which you want to show status. For this argument to be used, the group must be defined in an ASCII file called cli.groups in the /usr/app/base/config directory. Refer to the section "Creating cli.groups File
" later in this chapter for instructions on creating the cli.groups file.
To view the status of one or more traps for an MMA, perform the following steps:
Step 1 Verify that the target switch is correct by entering the following at the cli> prompt:
show chassis general
If you need instructions on changing the target switch, refer to the LightStream 2020 Network Operations Guide.
Step 2 Set the SNMP community to a read/write community by entering the following at the cli> prompt:
set snmp community <community name>
where:
<community name> = The SNMP read/write community that you want to access.
Step 3 At the cli> prompt, enter the following:
show trap <trap#> [<group name>]
where:
<trap#> = The number of the trap(s). Enter the symbolic trap name or trap number. You can set multiple trap numbers by specifying the trap numbers (ndd_3 ndd_14 lcc_5), or by using the wild card character "*" to specify all traps for a particular process. If you use *, you must enclose the expression in which it appears with quotes. For example, to specify all NDD traps, you would type show trap "ndd*".
[<group name>] = An optional argument that defines a group of traps. For this argument to be used, the group must be defined in an ASCII file called cli.groups in the /usr/app/base/config directory. Refer to the section "Creating cli.groups File
" later in this chapter for instructions on creating the cli.groups file.
If you now enter the command show trap ndd_3 ndd_4 ndd_5 ndd_1001, the status of these traps will be displayed as shown in Figure 2-14.

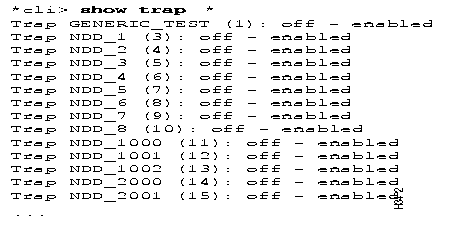
If you enter the command show trap "*", the status of all traps in the MMA will be displayed as shown in Figure 2-15. Note that Figure 2-15 is a partial display; several screens of traps will be displayed when you issue this command.
The cli.groups file defines groups of traps. You can use this file as an argument for the commands described in the sections above entitled "View Status of One or More Traps for Process" and "View Status of One or More Traps for MMA." If you do not create and maintain this file, you must manually enter each trap number used with those commands.
To create the cli.groups file, perform the following steps:
Step 1 To enter protected mode, enter the following at the cli> prompt:
protected
Step 2 Enter the protected mode password at the following prompt:
Step 3 Escape from the CLI to the LynxOS bash shell by entering the following at the *cli> prompt:
shell bash
Step 4 Move to the /usr/app/base/config directory by entering the following at the prompt:
cd /usr/app/base/config
Step 5 Invoke the vi editor by entering the following at the prompt:
vi cli.groups
When the editor opens the file, enter the group names and trap numbers in the format shown below. Note that each group definition begins with a colon.
where:
<groupname> = A name that defines the group of traps.
<trap#> = The trap numbers within the group.
The contents of your file will be similar to this:
Step 6 When you have finished entering the group names and trap numbers in the file, exit the vi editor by pressing the Esc key or ^[, and entering
ZZ
Step 7 To return to the CLI, enter the following at the prompt:
exit
Step 8 To exit protected mode, enter the following at the *cli> prompt:
|
|