|
|

The StrataView Plus Event Log displays descriptions of network- and operator-generated occurrences. Internally, event descriptions are generated as a result of the trap information which transpires between the network management system and the network agents. These traps are controlled by Simple Network Management Protocol (SNMP) processes.
An SNMP agent is software that is capable of answering valid queries from an SNMP station (such as your StrataView Plus workstation), about information defined in the Management Information Base (MIB). A network device that provides information about the MIB to StrataView Plus has an SNMP agent.
StrataView Plus and the SNMP agents exchange messages over the network's transport layer protocol. SNMP conducts five valid types of messaging:
Get-Request | Used by StrataView Plus to retrieve information from network devices that have SNMP agents. |
|---|---|
| Get-Response | Response by network agent to the Get-Request message. The response typically includes system information such as the name of the system, how long the system has been running, and number of network interfaces on the system. |
| Get-Next-Request | Used with Get-Request when compiling the list of objects, to ask for the next object in the table. |
| Set-Request | Enables remote configuration of parameters on a device. |
| Trap | An unsolicited message by an SNMP agent to the StrataView Plus. Trap messages inform the server about the occurrence of a specific event. |
The StrataView Plus SNMP traps are enhanced by a Robust Trap Mechanism (RTM) to ensure detection and retrieval of missed traps. With RTM, StrataView Plus can maintain sequential tracking of traps from specific agents. SV+ detects missed traps as based on sequence numbers and uploads the missing number from the agent using SNMP Get-Requests.
The AXIS node reports the aggregate shelf alarm status. This is evident at the LED on the node which is affected by a specific new trap.
The StrataView Plus Event Log Database is an Informix" Relational Database used to capture event log messages from the network. After 8192 records have been captured, each succeeding record causes the database to wrap around, replacing the oldest record with the newest record. The Event Log window displays the latest events from the node. As long as the scroll bar is at the bottom of the log, new data is displayed as it arrives from the node.
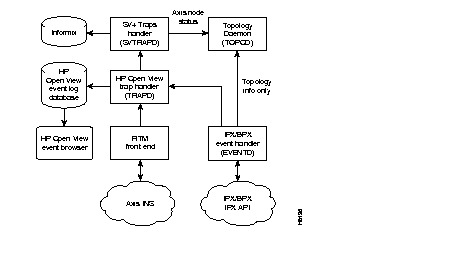
Once these events have been captured in the database, users can selectively filter the data using their own search criteria. This search capability is a flexible tool for troubleshooting the nodes in a network. You can configure the event log to filter reports by network name (non-structured network), domain (structured network); time, date, and time zone; node name; alarm type; and specific search strings.
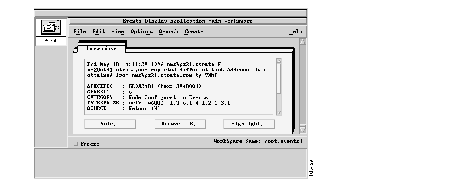
The application area contains an instance of an application, for example, the Events application shown in Figure 4-2. The application controls the content displayed in this area of the control desk.You can drag the application outside the Control Desk Window by using the window handle.
The 8.2 Release of StrataView Plus uses the NetView Events Display application to list the events and alarms. When you select the StrataCom Events category, all events triggered by StrataCom's network elements are shown in the new window. This window contains menus for configuring event displays and saving event information.
Event Monitoring reports information such as:
Date/Time | The week, calendar date, and time of event occurrence. |
| Message | Description of the event. |
| Source | The object identifier affected by the event. |
| Severity | This column displays the criticality of the event. Severity values are: critical, major, minor, warning, and normal. |
You can select the events you want to display by activating and deactivating filters using the Filter Control Window.
The Filter Control window contains two sections:
When you click the File List button, the File Selection window appears. (See Figure 4-3.)
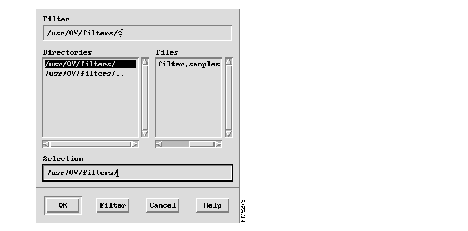
Use the File Selection window to select file or another filter directory.
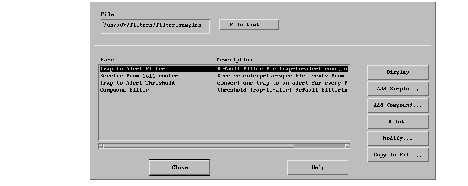
Use the filter editor to:
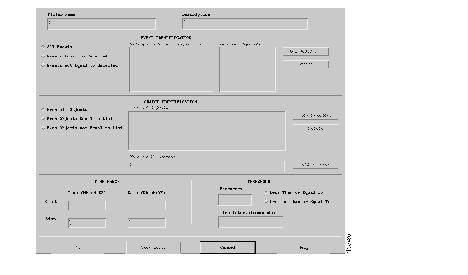
Use the Simple Filter Editor Window to:
To receive one particular event do the following:
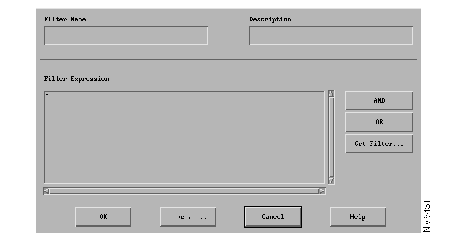
Compound filters are created by joining several existing simple filters. These filters can be used to specify CMIS (Common Management Information Services) expressions that cannot be specified using the Simple Filter Editor.
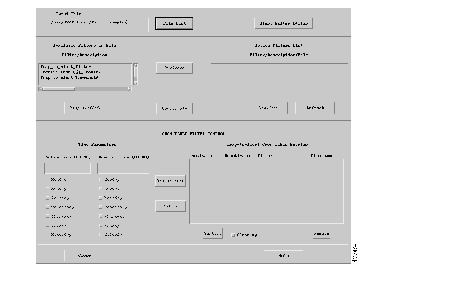
Trap-to-Alert filters permit selected events to pass to the tralertd daemon, which converts events and traps to alerts. You can create and activate filters that limit the number of traps to be processed by the tralertd daemon.
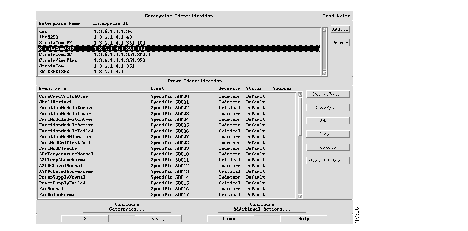
Use Event configuration to perform the following tasks:
|
|