|
|

The SV+ Statistics menu provides tools to present data reports, edit object linkage, and deactivate statistics generation on non-existent nodes. This chapter describes how to select, configure, and display statistics by using the Raw and IPX Data Report functions of the Statistics menu. Menu items File through Window are described in the Wingz' Reference Manual.
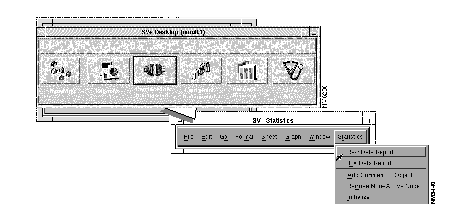
Use this menu to access the Raw and IPX Data Report menus.
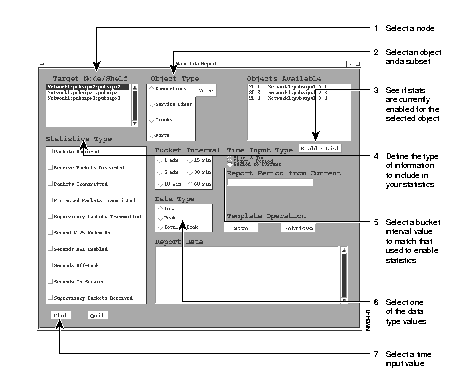
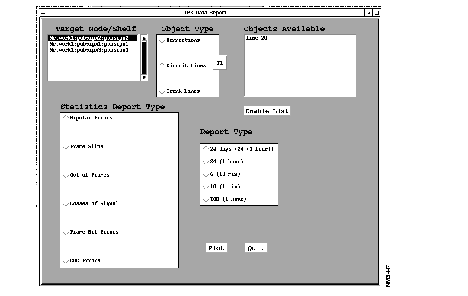
The Raw Data Report menu presents the Raw Data Report window, which provides options to enable customization of your reports. By using the Raw Data Reports function, you can generate reports for Connections, Service Lines, Trunks, and Ports. Once you select one of these objects types in the Raw Data Report form, associated parameter fields appear on the form.
You use the same procedure to configure any type of Raw Data Report.
Step 1 Select a node.
Step 2 Select an object and a subset.
Step 3 See if stats are currently enabled for the selected object.
Step 4 Define the type of information to include in your statistics.
Step 5 Select a bucket interval value to match that used to enable statistics.
Step 6 Select one of the data type values.
Step 7 Select a time input value.
Step 8 Select Plot
| Time Input Type | Description |
| Start & End | Use this parameter to define statistics spanning a starting date and time to an ending date and time. |
| Start + Period | Use this parameter to define statistics beginning at a starting date and time and spanning a specified period or minutes (m), days (d), and/or hours(h).
Example: To indicate a single value for one day and two hours and 10 minutes, type 1d 2h 10m. |
| Period to Current (default) | Use this parameter to define statistics from the present backwards, within values of minutes (m), hours (h), or days (d).
Type the number of m, h, or d into the Report Period field. Example: To indicate a value for 24 hours, type 24 h. |
Step 9 After you define a time value, select an object name in the Objects Available field. This results in presentation of the selected statistics in the Report Data field.
Step 10 Click the Plot button to start the query. A Querying database dialog window appears for each statistic retrieved during the search process. If no statistics are found, the dialog window reports "No data available." If statistics are enabled and collected, a Select Graph type box is presented.
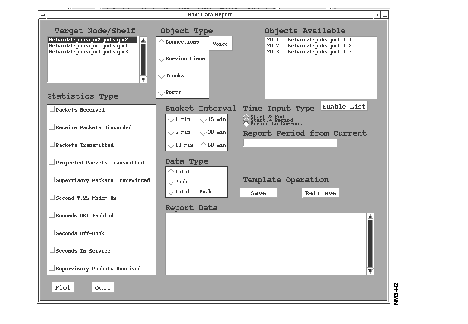
| Connections | Select from range: Voice, Data, Frame Relay, FastPAD, or ATM. |
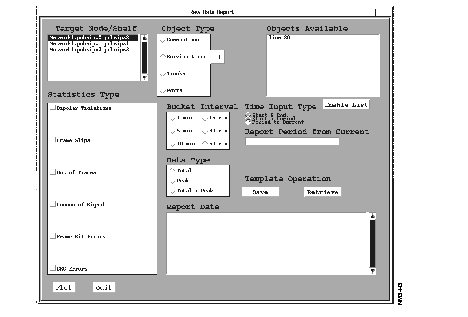
| Service Lines | Select from T1, E1/J1, or ASI |

| Trunks | Select from IPX/AXIS Narrowb, IPX/AXIS ATM, or BPX ATM |
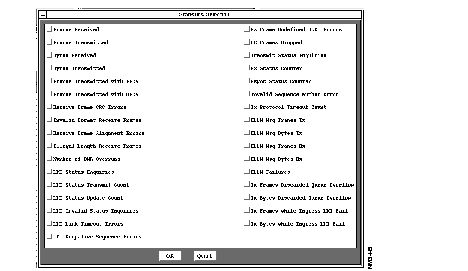
| Ports | Leads to Statistics Selection screen |
A displayed Raw Data Report can be printed from Wingz by first clicking on "File" at the far left of the SV+ Statistics Menu Bar, and then selecting either the Page Preview or Print commands from the displayed pull-down menu.


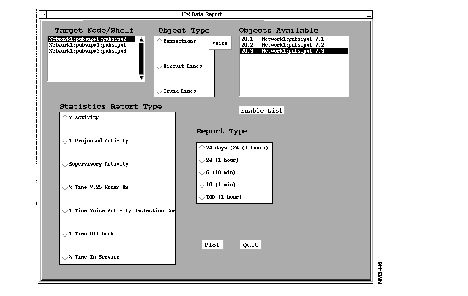
The following paragraphs describe how to display IPX data reports for three types of defined IPX Network objects: connections, circuit lines, and packet lines. The IPX Data Report menu provides preconfigured histograms including TOD reports.
The IPX Data Report option provides five types of reports. These are listed in Table 6-1. The right hand column, Bucket Type Enable Required, shows the bucket type that has to be enabled in order to get the listed type of report. For example, to collect 1 minute [10 (1 min)] and 10 minute [6 (10 min)] reports, the 1 minute and 10 minute buckets, respectively, must have been enabled for the selected statistic.
The first four types, which are sometimes referred to as history reports, show either an accumulated total for the indicated interval or a percentage depending on the statistic type. The fifth type, referred to as a TOD report, spans the 24 hours in a day and shows either the highest total quantity or highest percentage to date for each hour of the day. It also shows the highest peak to date (usually, minute peak) for each hour of the day

| Report Type | Display Granularity | Total Time Span of Display | Units | Bucket Type Enable Required |
|---|---|---|---|---|
| History Report Type | ||||
| 24 days (24 (1 hour) | 1 day | 24 days | total quantity or percentage | 60 min |
| 24 (1 hour) | 1 hr | 24 hrs | total quantity or percentage | 60 min |
| 6 (10 min) | 10 min | 60 min | total quantity or percentage | 10 min |
| 1 (10 min) | 1 min | 10 min | total quantity or percentage | 1 min |
| Time of Day Report Types | ||||
| TOD | 1 hr | 24 hrs | average and peak quantities or percentage that has occurred over an interval of N days. | 60 min |
A displayed IPX Data Report can be printed from Wingz by first clicking on the File pull-down menu at the far left of the SV+ Statistics Menu Bar, and then selecting either the Page Preview or Print commands from the displayed pull-down menu.
The percentage statistics are a measure of the ratio of occurrence of a value over time compared to the maximum quantity that could occur. For example, if a modem was on an average of 12 minutes in each hour, then its percentage activity would be: 12/60 x 100% = 20%. The statistics interval must be the same as the report interval selected (see Reports table beginning on next page).
| Statistics | Notes |
|---|---|
| Connections | |
| Voice Connections Report Type | Statistics Requiring Enabling |
| % Activity | Packets Transmitted |
| % Projected Activity | Projected Packets |
| % Supervisory Activity | Supervisory Packets |
| % Time V.25 Modem On | Seconds V.25 Modem On |
| % Time Voice Activity Detection Enabled | Seconds DSI Enabled |
| % Time Off-Hook | Seconds Off-Hook |
| % Time In Service | Seconds in Service |
| Data Connections Report Type | Statistics Requiring Enabling |
| % Activity | Packets Transmitted |
| % Projected Activity | Projected Packets |
| % Supervisory Activity | Supervisory Packets |
| % Time in Service | Seconds in Service |
| Frame Relay Connections Report Type | Statistics Requiring Enabling |
| % Offered Frames | Frames Received |
| % Frame Activity | Frames Received |
| % Dropped Frames | Xmt. & Rcv. Frames Discarded |
| % Offered Data | Bytes Received |
| % Activity | Bytes Received |
| % Dropped Data | Receive Bytes Discarded |
| % Time in Service | Seconds in Service |
| Circuit Lines | |
| T1 Circuit Lines Report Type | Statistics Requiring Enabling |
| Bipolar Errors | Bipolar Violations |
| Frame Slips | 1 |
| Out of Frames | 1 |
| Losses of Signal | 1 |
| Frame Bit Errors | 1 |
| CRC Errors | 1 |
| E1 Trunk Report Type | Statistics Requiring Enabling |
| Out of Frames | 1 |
| Losses of Signal | 1 |
| Frame Bit Errors | 1 |
| CRC Errors | 1 |
| Out of Multi-Frames | 1 |
| All Ones in Timeslot 16 | 1 |
| Trunks | |
| T1 Trunk Report Type | Statistics Requiring Enabling |
| Bipolar Errors | Bipolar Violations |
| Frame Slips | 1 |
| Out of Frames | 1 |
| Losses of Signal | 1 |
| Frame Bit Errors | 1 |
| CRC Errors | 1 |
| Packet Out of Frames | 1 |
| Packet Errors | Packet CRC Errors |
| Voice Packets Dropped | 1 |
| TS Packets Dropped | 1 |
| Non-TS Packets Dropped | 1 |
| PCC Packets Dropped | 1 |
| BData Packets Dropped | 1 |
| Mcst Packets Dropped | Bdata B Packets Dropped |
| T1 Trunk Report Type (continued) | Statistics Requiring Enabling |
| Offered Multicast Bandwidth | BData B Packets Transmitted |
| Line Activity & Minute Peaks | Total Packets Transmitted |
| E1 Trunk Report Type | Statistics Requiring Enabling |
| Out of Frames | 1 |
| Losses of Signal | 1 |
| Frame Bit Errors | 1 |
| CRC Errors | 1 |
| Packet Out of Frames | 1 |
| Packet Errors | Packet CRC Errors |
| Voice Packets Dropped | 1 |
| TS Packets Dropped | 1 |
| Non-TS Packets Dropped | 1 |
| PCC Packets Dropped | 1 |
| BData Packets Dropped | 1 |
| Mcst Packets Dropped | BData B Packets Dropped |
| Offered Multicast Bandwidth | BData B Packets Transmitted |
| Line Activity & Minute Peaks | Total Packets Transmitted |
| Subrate Trunks | Statistics Requiring Enabling |
| Losses of Signal | 1 |
| Packet Out of Frames | 1 |
| Packet Errors | Packet CRC Errors |
| Bad Clock Errors | 1 |
| Voice Packets Dropped | 1 |
| TS Packets Dropped | 1 |
| Non-TS Packets Dropped | 1 |
| PCC Packets Dropped | 1 |
| BData Packets Dropped | 1 |
| Mcst Packets Dropped | BData B Packets Dropped |
| Offered Multicast Bandwidth | B Data Packets Transmitted |
| Line Activity & Minute Peaks | Total Packets Transmitted |
Ensure that the bucket interval matches the granularity of the data report. For example, a 60-minute % activity report requires that "packets transmitted" be enabled for 60-minute buckets. The minimum bucket interval for frame relay statistics is 5 minutes.
Select the Add Comment to Object option from the Statistics pull-down menu to present the Add Comment screen. An object-specific comment you type and apply in this screen is linked to the object for database applications. The comment is not displayed by StrataView Plus.
This menu presents the Add Comment window.
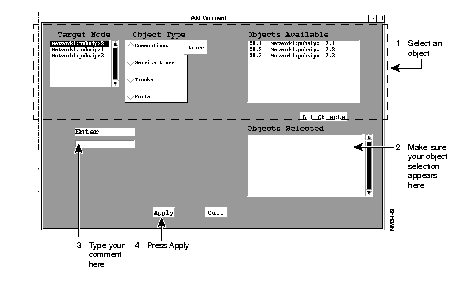
After you press apply, a confirmation dialog appears. Press OK to finish the Add Comment operation.
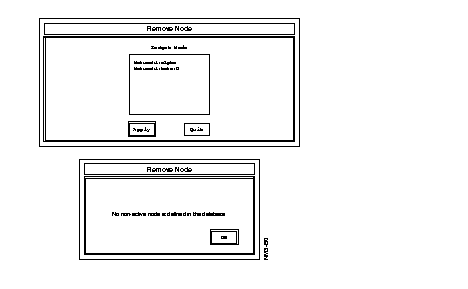
Select the Remove Non-Active Nodes option from the Statistics pull-down menu to display the Remove Node Menu. In the Target Node box, select the nodes you want to delete, then click on the Apply button. If there are no non-active nodes, a dialog box displays the message "No non-active node is defined in the database".
This menu presents the Remove Node dialog boxes. Select a node from the Target Node list and click the apply button to delete a node. If all nodes are active, an information dialog appears. Active nodes cannot be removed from the system with this operation.
Reset the Statistics pulldown window by clicking on the Initialize option.
Use this function (delstrecs) to delete statistical records associated with an object database that no longer exists.
To start a delete statistics operation, type delstrecs on the StrataView Plus console command line. You are asked to indicate a retention period in days. Records older than the specified number of days will be deleted. More recent records will be retained.
To delete all records not associated with an active object, and to delete all unmatched records regardless of age, type a zero (0) when prompted for retention period. You should perform this operation periodically to clean out the statistics database.
|
|