WorkShop Development Environment

Present day software developers are pushing the limits of technology by designing
increasingly complex and sophisticated systems. Applications now take advantage of
multiple languages, multiple processors, increased processor speed, 3-D graphics and
multimedia. Traditional tools are inadequate in effectively supporting developers working on
advanced technology.
WorkShop is the most advanced environment available for UNIX today, offering an integrated set
of powerful and highly visual tools for software development, enhancement and maintenance. Based
on a powerful object oriented architecture, WorkShop is built from the ground up, providing
unparalleled levels of integration and functionality.
Most application developers construct an abstract mental model of their applications.
WorkShop can unlock their creativity by helping them visualize various aspects of their applications.
A Comprehensive Programming Environment
WorkShop provides all the tools that are required for source analysis,
debugging, and tuning. The five tools in WorkShop are:
- Static Analyzer -
all Workshop tools come with powerful graphical browsers to show relationships in
the software code. These browsers can display or collapse subgraphs, and pan, zoom and
filter graphs in varied ways.
- Debugger -
dynamic, source-level debugger designed to handle the complexities of modern programming
environments.
- Build Analyzer - displays make file dependencies and
allows execution of recompiles from the WorkShop environment
- Performance Analyzer -
assists in program tuning and optimization
- Tester - test coverage analysis tool
 Click to view a jpeg image (119KB).
The tools are X/Motif (tm) based, so they can be displayed on any X-based system.
All of the tools share a common, integrated environment that includes an
annotated source viewer, context-sensitive on-line
help, and color schemes that can be modified by user.
Supports Numerous queries - A broad range of queries are available to the user
for easier comprehension of complex code.
Powerful Graph Browser - Allows the user to see the structure of a program.
The browser can display or collapse subgraphs, and pan, zoom and
filter graphs in varied ways.
 Click to view a jpeg image (88KB).
 (QuickTime 7MB)
 (AIFF 300KB)
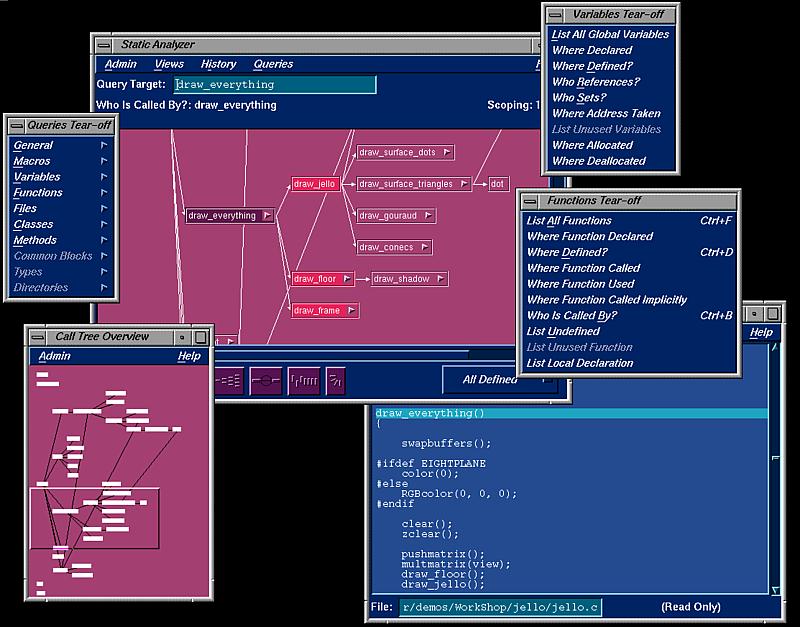
The WorkShop Static Analyzer is a visual source code
navigation and analysis tool. It operates in two modes:
- scan mode - based on a fast pattern matching mechanism, it is ideal for analyzing code that does not compile
- compiler mode - invokes a native compiler and generates a database from symbol
table information, providing the ability to perform more complex queries
With the Static Analyzer, users can visualize the structure of their programs
and easily navigate through their code, which is vital for restructuring and
re-engineering existing software. Its graphical presentation of the structure of
code makes it very easy to understand, even for someone who is not the original developer.
It is also helpful in porting situations when code that is being ported to other platforms
will not run or compile.
Multiple Views
The Static Analyzer provides a variety of different views:
- Call Tree View - displays the results in the form of a call graph.
(Arcs represent caller-callee relationships between functions)
- C++ Class Tree View - displays the class hierarchy of the code, and
supports queries on both classes and methods
- File Dependency View - displays the include dependencies between files
FORTRAN Support
The Static Analyzer provides excellent performance on complex FORTRAN
programs, and is useful for analyzing dusty deck code.
 Click to view a jpeg image (98KB).
(QuickTime 17MB)
(AIFF 800KB)
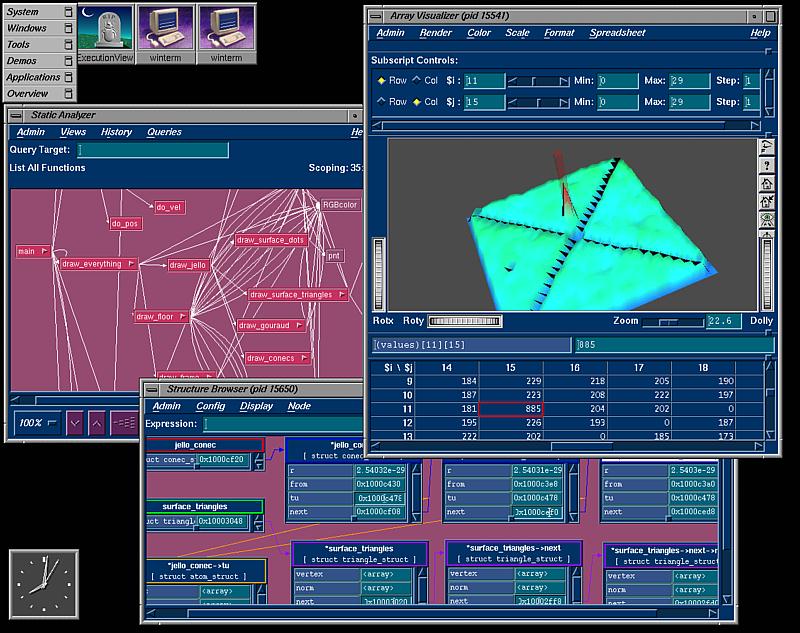
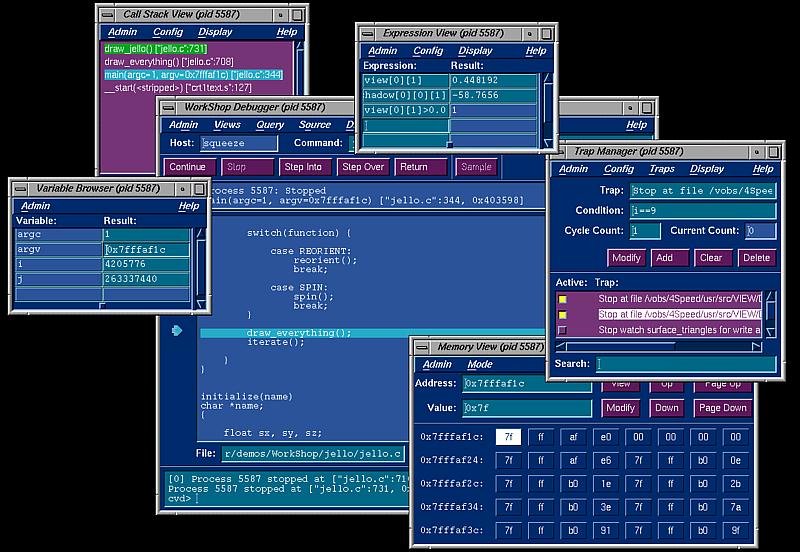
The WorkShop debugger, cvd, is a state-of-the-art source-level debugger featuring multiple graphical views that are
dynamically updated during a program execution. It was written from the ground up by Silicon Graphics developers to provide functionality unavailable in standard UNIX debuggers. It is tightly integrated with the other tools, particularly the Performance Analyzer, providing increased efficiency for overall program analysis.
The WorkShop debugger has specific tools designed to help the FORTRAN programmer, such as the Array Browser and the 3-D Array Visualizer, and syntactical understanding of FORTRAN.
Scalability
In large-scale development efforts, cvd provides unparalleled support for large programs. Other debuggers that provide such high levels of functionality often cannot handle programs over 50,000 lines of code. Not only can cvd handle millions of lines of source and executables over 100MB, it facilitates the debugging effort by providing different views into the code, which allows for better understanding of large amounts of data.
Enhanced Productivity through Visualization
Tools such as the 3-D Array Visualizer and the Structure Browser allow users to identify problems in their code by examining the visual representation of the expressions or data. cvd provides 15 different "views" into a program that are dynamically updated as the user steps through the program.
Fast Data Watchpoints
Most debuggers that support watchpoints do so by single-stepping the target process, thereby slowing the program down by several orders of magnitude. The WorkShop debugger, with support from the IRIX(tm) operating system, implements fast data watchpoints that permit better performance of the target process than traditional implementations.
Source Level Expression Evaluation
The WorkShop debugger allows programmers to evaluate FORTRAN, C and C++ expressions in their native syntax. cvd has extensive support for C++ expressions such as static and non-static data members, virtual functions, multiple inheritance and virtual base classes.
Multiple Process and Distributed Debugging
MP View provides debugging support for programs that have multiple processes or have been parallelized. It permits automatic or manual specification of process groups, and provides individual and group process control. Traps can be set to stop a single thread or all threads. cvd is based on a client/server model, allowing distributed debugging.
Integration with GL Debug
GL (tm) Debug, a set of tools designed for debugging code using Open GL (tm), can be invoked at the start of a debugging session in cvd.
Machine-level Debugging
Three views provide powerful machine-level debugging capabilities: Register View, Memory View and Disassembly View. Each view allows the modification of the values it displays. The Disassembly View allows disassembly of the displayed code by address, function or file.
Command-Line Interface
Efficient access to most dbx commands is provided for those who prefer a command line interface.
Integrated Build and Dynamic
Loading the WorkShop debugger allows the user to change a
source file, create a shared object, and load it dynamically,
preempting previous implementations.
Deferred Evaluation of the Symbol Table
Symbol table information is loaded as required into the
debugger, often resulting in faster startup on large applications.
(QuickTime 6MB)
(AIFF 300KB)
The Build Analyzer provides seamless integration of the compilation
process by allowing users to launch recompiles from within the WorkShop
environment. It also provides graphical depictions of makefile dependencies.
The Build Analyzer can be invoked from any of the WorkShop tools when a
recompile is requested. The WorkShop debugger automatically detaches from the
active process and brings up the build window. The user can recompile from
this window, and modify the makefile if necessary. Any compilation errors are
listed in the build window, and the relevant source can be accessed by
selecting the error. When the build terminates successfully, the Build
Analyzer automatically attaches the debugger to the newly built executable.
 Click to view a jpeg image (1.15 MB).
(QuickTime 3MB)
(AIFF 200KB)
Performance tuning is one of the most difficult programming tasks. This is a
time-consuming and complex process that generally results in large amounts of
data that is very difficult to analyze and comprehend.
The lack of good tools for both data collection and analysis make it even
more difficult for the programmer to interpret performance data.
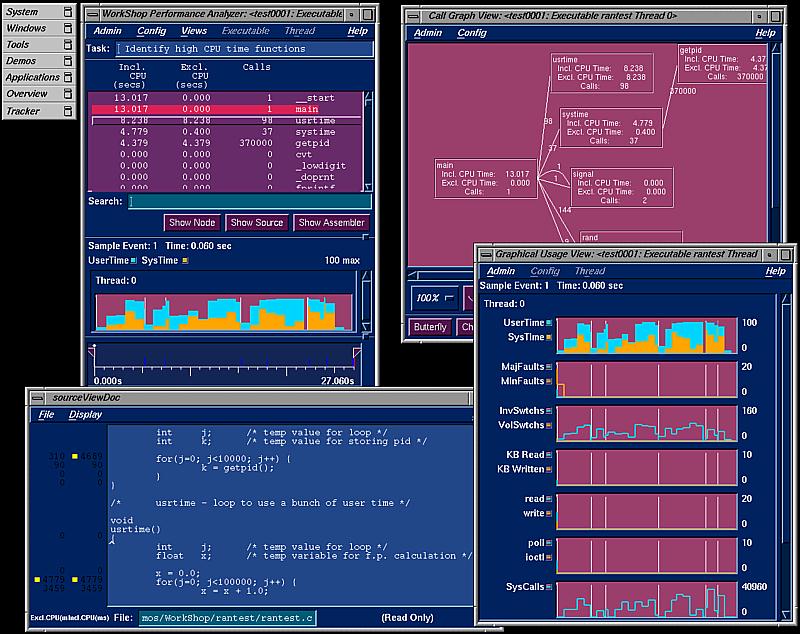
The Performance Analyzer is an integrated collection of tools that measure,
analyze, and help to improve application performance. Tightly integrated with
the debugger, it allows the user to visualize a program's performance over
separate phases of execution, and correlate the information back to the
source code.
Multiple Graphical Views
The Performance Analyzer has an integrated set of graphical views that
visually represent performance data:
Resource Usage View-helps analyze resource usage consumption of the
program over different phases of execution (Graphical stripcharts are used
to display resources such as CPU time, page faults, and context switches)
Call Graph View - displays a partial call graph of the program, annotated
with profiling information
I/O View - displays read and write activity on a per file-descriptor basis
in a stripchart
Heap View - a color-coded map of the dynamic memory of the program that
clearly identifies memory leaks and erroneous frees
Annotated Source and Disassembly Views-the source file is displayed,
annotated with performance information.
The Function List displays all functions in the program, highlights expensive
functions and their associated performance usage, and suggests efficient
program ordering.
The relevant source or assembly code is annotated with performance
information.
Task-Oriented Data Collection
The Performance Analyzer presents a task-oriented model to the user. Users
are able to specify a highlevel task (e.g., Show Memory Leaks) and then run
experiments that will automatically collect the appropriate data.
Identification of Expensive Functions
The Function List displays all of the functions in the program, highlights
expensive functions and their associated performance usage, and also suggests
more efficient program ordering.
Support for Multiple Process and Distributed Applications
The Performance Analyzer helps tune multi-process and distributed
applications. All of the views show performance statistics on a per thread
basis. The tools provide the ability to correlate the performance of all
threads.
 Click to view a jpeg image (1 MB).
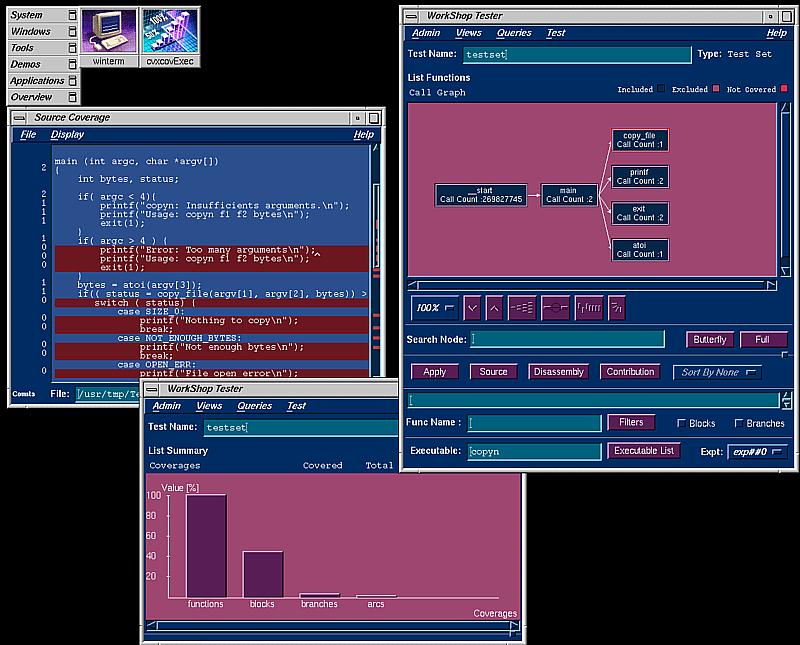
WorkShop Tester is a software quality assurance toolset for dynamic test
coverage over any set of tests. It is a separate WorkShop module that is
seamlessly integrated with the rest of the CASEVision tools.
Tester supports programs written in C, C++ and FORTRAN, and allows execution
of tests from the command-line as well as from the GUI.
Improved Software Quality
Tester helps users to build and maintain higher quality software products. It
provides useful measures of test coverage over a set of tests or experiments,
and provides comparison of coverage over different program versions. Tracing
capabilities are provided for function arcs and arguments that go beyond
traditional test coverage tools.
Comprehensive Coverage Analysis
Tester supports multiple types of test coverage, selection and filtering,
including:
- Line coverage - how many times was a line executed
- Basic block coverage - how many times was this basic block executed
- Function - how many times was this function executed
- Branch - did this condition take on both TRUE and FALSE values
- Arc - was function F called by function A and function B which arcs for
function F were NOT taken
- Argument - what were the maximum and minimum values for argument X in
function F over all tests
- Cutoff percentages - what functions have basic block coverage greater than
75%
- Inclusion/exclusion based on library/file/function
- show coverage for function XYZ only
- exclude libraries libc, libX* from coverage analysis
Test Reporting
CASEVision/WorkShop Tester also provides the user with a number of test
reports. These reports include:
- A summary of test coverage, including dynamic coverage metric
- List of functions sorted by number/percentage of blocks/branches covered
- Comparison of test coverage between different versions of the same program
- Mapping of tests to actual coverage to show test contribution
Supports Multiple Test Sets
WorkShop Tester supports the use of multiple test sets. The user can define
the set of tests for test coverage analysis (e.g., 1000 tests for program A),
and can also define a test group to include different programs that share a
common library. (e.g., coverage is for libc which has many clients.)
![[Silicon Surf]](../images/home_icon.gif)


 Click to view a jpeg image (119KB).
 Click to view a jpeg image (88KB).
 Click to view a jpeg image (98KB).
 Click to view a jpeg image (1.15 MB).
 Click to view a jpeg image (1 MB).