|
|

This chapter describes how to manage your hub or hub stack using the management console.
It is important to understand that you can manage the hub stack at three levels:
The FastHub console port must be configured to the same baud rate and character format as the terminal or modem. Although the match-baud-rate option (auto baud, configured through the Console Port menu) matches the baud rate when the FastHub is answering an incoming call, the FastHub does not change from its configured rate when dialing out. In addition, the FastHub only matches a baud rate lower than its configured rate. When it completes a call and disconnects, the FastHub always returns to the last configured baud rate.
Following are the default characteristics for the FastHub console port:
Use the Console Port menu to change any defaults.
The management console is a menu-driven interface, as shown in Figure 4-1. Management console screens include menus through which the configuration of the FastHub can be modified and menus that present network conditions and statistics.
Table 4-1 shows how to use a standard keyboard to control the management console interface and access online help:
| Task | Key |
|---|---|
| Move the menu cursor. | Left, right, up, or down arrow keys. |
| Select a menu item. | Position the cursor on the command or its parameter value and press Enter. |
| Move to the beginning of a text field. | Home key. |
| Move to the end of a text field. | End key. |
| Move the text-edit cursor. | Right and left arrow keys. |
| Move to the OK and Cancel buttons. | Tab key. |
| Cancel the current menu selection and return to the Main Menu from a submenu. | Esc key. |
| Access Help information for an item. | Select the item, then press either the F3 or ? key. |
Unit numbers shown in the management console screens reflect the actual physical positions of the units in the hub stack. The management console uses a unit numbering convention, assigning hubs unit numbers from the bottom up--the hub at the bottom of the stack is unit 1, the hub above unit 1 is unit 2, and so on.
The Port Selection and Port Statistics screens reflect the actual physical positions of the ports in each unit. The base configuration ports are numbered from 1 to 16, left to right. If a 100BaseTX/16 port expansion module is installed, its ports are numbered from 17 to 32, left to right.
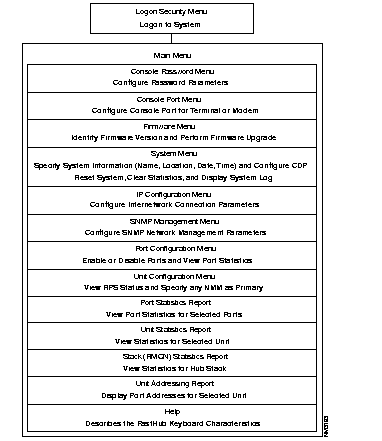
Table 4-2 describes the various methods of resetting the FastHub.
 | Caution Resetting to factory defaults is not reversible; all system parameters revert to factory defaults, and the original configuration is irrecoverable. |
| Caution Resetting to factory defaults causes all ports to come up enabled. Ports that were previously disabled through "Port status" are enabled after the reset. |
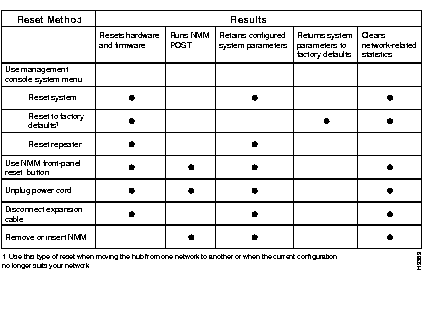
Table 4-3 lists management console menu items and, if applicable, their default settings. The items are listed in the sequence that they appear in the management console menu tree (see Figure 4-1).
| Menu Item | Default Setting | Management Console Menu |
|---|---|---|
| Password intrusion threshold | None | Console Password |
| Silent time upon intrusion detection | None | Console Password |
| Modify password | - | Console Password |
| Baud rate | 9600 | Console Port |
| Data bits | 8 | Console Port |
| Stop bits | 1 | Console Port |
| Parity setting | None | Console Port |
| Match remote baud rate (auto baud) | Enabled | Console Port |
| Auto answer | Enabled | Console Port |
| Time delay between dial attempts | 300 seconds | Console Port |
| Number for dial-out connection | - | Console Port |
| Initialization string for modem | 0 | Console Port |
| Upgrade status | - | Firmware |
| Primary supervisor | - | Firmware |
| Standby supervisor | - | Firmware |
| Supervisor boot version | - | Firmware |
| Supervisor mgmt version | - | Firmware |
| Upgrade auto distribution | Enabled | Firmware |
| Server accept TFTP upgrade requests | Enabled | Firmware |
| Name or IP address of TFTP server | - | Firmware |
| Filename for firmware upgrade | - | Firmware |
| Initiate TFTP upgrade | - | Firmware |
| Initiate XMODEM upgrade | - | Firmware |
| Name of system | - | System |
| Contact name | - | System |
| Location | - | System |
| Date | - | System |
| Time | - | System |
| Management console inactivity timeout | None | System |
| Use Cisco Discovery Protocol (CDP) | Enabled | System |
| CDP message interval | 60 seconds | System |
| Reset system | - | System |
| Reset to factory defaults | - | System |
| Reset repeater | - | System |
| Display Supervisor log | - | System |
| Display CDP neighbors | - | System |
| IP address of system | 0.0.0.0 or no IP address | IP Configuration |
| IP subnet mask | 0.0.0.0 or no mask | IP Configuration |
| IP address of default gateway | 0.0.0.0 or no gateway address | IP Configuration |
| IP address of DNS server 1 | 0.0.0.0 or no IP address | IP Configuration |
| IP address of DNS server 2 | 0.0.0.0 or no IP address | IP Configuration |
| DNS domain name | - | IP Configuration |
| Use routing information protocol | Enabled | IP Configuration |
| READ community string | 0 | SNMP Management |
| WRITE community string | 0 | SNMP Management |
| Authentication trap generation | Enabled | SNMP Management |
| Write manager names | 0 | SNMP Management |
| Trap manager names | 0 | SNMP Management |
| Trap manager community strings | 0 | SNMP Management |
| Port name | - | Port Configuration |
| Port status (port enabled or disabled) | Enabled | Port Configuration |
| RPS status | - | Unit Configuration |
| Power source | - | Unit Configuration |
| Supervisor | - | Unit Configuration |
| Boot version | - | Unit Configuration |
| Mgmt version | - | Unit Configuration |
| Current Primary Supervisor is unit | - | Unit Configuration |
| Clear statistics | - | Stack (RMON) Statistics Report |
This section describes the management console screens.
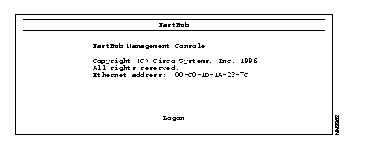
Although you can assign a password to limit access to the management console, it is not required (the password prompt does not display if a password has not been assigned).
To logon (see Figure 4-2), select Logon, and press Return. The Main Menu is displayed.
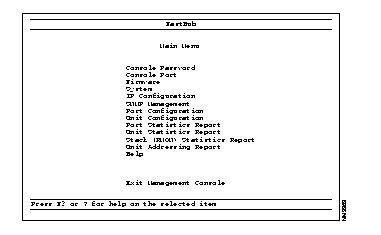
Select one of the Main Menu items (see Figure 4-3), and press Return. Selecting the Exit Management Console option returns you to the Logon Security Menu. The other menu options are described in the following sections.
Use the Console Password menu (see Figure 4-4) to configure the management console logon parameters.
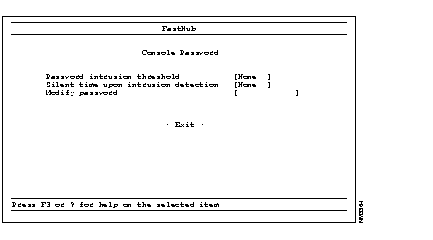
Password intrusion threshold. Enter the number of failed logon attempts allowed before the management console shuts down for a configured duration.
Silent time upon intrusion detection. Enter the number of minutes during which the management console is unavailable after password intrusion threshold has been exceeded.
Modify password. Change your logon password.
Exit. Return to Main Menu.
Use the Console Port menu (see Figure 4-5) to configure the NMM console port.
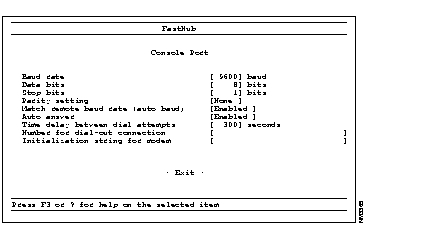
Baud rate. Enter the signal speed for the console port.
Data bits. Enter the number of data bits for the console port.
Stop bits. Enter the number of stop bits for the console port.
Parity setting. Enter the parity setting for the console port.
Match remote baud rate (auto baud). Enable or disable auto-baud detect for the console port. When enabled, the console port automatically determines the baud rate of an incoming call and switches to that baud rate.
Auto answer. Enable or disable auto-answer for the console port. When enabled, the system automatically answers incoming calls on a modem attached to the console port.
Time delay between dial attempts. Enter the time in seconds that the management console delays before each attempted dial-out connection.
Number for dial-out connection. Enter the number used for dial-out connection.
Initialization string for modem. Enter a modem initialization string.
Exit. Return to Main Menu.
Use the Firmware menu (see Figure 4-6) to display system firmware version levels, identify which unit houses the primary NMM, and perform firmware upgrades.
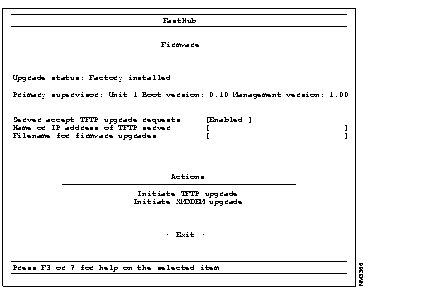
Upgrade status. Displays the date and time of the last firmware upgrade and the IP address of the TFTP server where the upgrade file resided. Also indicates whether the upgrade was successful.
Primary supervisor. Identifies which unit in the hub stack houses the NMM serving as the primary supervisor.
Boot version. Displays the version number of the bootstrap firmware on the primary NMM.
Management version. Displays the version number of the management firmware on the primary NMM.
Server accept TFTP upgrade requests. This is the first of three items used to configure a Trivial File Transfer Protocol (TFTP) upgrade. The TFTP upgrade is the in-band upgrade method discussed in detail in the FastHub 300 Series MIB Reference Manual. Use this item to specify whether the FastHub accepts TFTP write requests from the management console.
Name or IP address of TFTP server. This is the second of three items used to configure a TFTP upgrade. Use this item to name the TFTP server from which the firmware file is downloaded.
Filename for firmware upgrade. This is the third item used to configure a TFTP upgrade. Use this item to specify the name of the firmware upgrade file downloaded from the server.
Initiate TFTP upgrade. Initiate the TFTP upgrade process. Note that the second confirmation prompt allows you to verify the upgrade file path, filename, and the server address.
Initiate XMODEM upgrade. Initiate an out-of-band firmware upgrade. The XMODEM protocol is used to perform this upgrade.
Exit. Return to Main Menu.
Use the System menu (see Figure 4-7) to do the following:
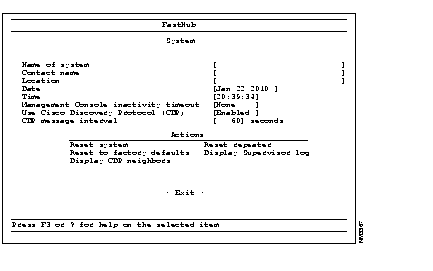
Name of system. Enter a name for the system.
Contact name. Enter the name of the person or organization responsible for administering the system.
Location. Enter the location of the system.
Date. Set the system date.
Time. Set the system time.
Management console inactivity timeout. Enter the number of minutes that the management console can go without activity, after which it becomes unavailable and a password needs to be reentered.
Cisco Discovery Protocol (CDP) status. Enable or disable CDP on this hub or hub stack. Using CDP, the FastHub can advertise its existence to other devices and receive information about other devices on the same LAN.
CDP message interval. Enter the interval in seconds that CDP messages are generated on this hub or hub stack.
Reset system. Resets the FastHub hardware and firmware, does not run the NMM POST, retains all configured system parameters, and clears all network related statistics.
Reset to factory defaults. Resets the FastHub hardware and firmware, does not run the NMM POST, changes all configured system parameters to their factory defaults, and clears all network related statistics.
Reset repeater. Resets the FastHub hardware, does not run the NMM POST, retains all configured system parameters, and retains all network related statistics.
Display Supervisor log. Displays supervisor log information.
Display CDP neighbors. Displays CDP cache information.
Exit. Return to Main Menu.
Use the Internet Protocol (IP) Configuration menu (see Figure 4-8) to configure internetwork connection parameters.
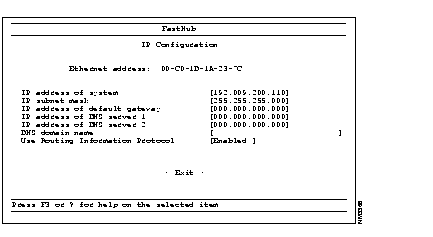
Ethernet address. Displays the Ethernet address of the system.
IP address of system. Enter the system IP address.
IP subnet mask. Enter a subnet mask for the system.
IP address of default gateway. Enter the IP address of the default gateway.
IP address of DNS server 1. Enter the IP address of Domain Name System (DNS) server 1.
IP address of DNS server 2. Enter the IP address of DNS server 2.
DNS domain name. Enter the DNS domain name.
Use Routing Information Protocol. Enable or disable the Routing Information Protocol (RIP) listener. The RIP listener automatically discovers IP gateways.
Exit. Return to Main Menu.
Use the SNMP Management menu (see Figure 4-9) to configure SNMP network management parameters. The read and write community strings are used by the SNMP agent to control requests for information about, and access to, management information for the repeater.
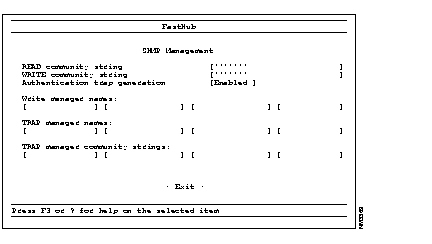
READ community string. Enter the SNMP-agent read (Get) community string. The community string serves as a password to authenticate messages sent between the FastHub and the SNMP agent.
WRITE community string. Enter the SNMP-agent write (Set) community string. The community string serves as a password to authenticate messages sent between the FastHub and the SNMP agent.
Authentication trap generation. Enable or disable the generation of SNMP authentication traps. An authentication trap alerts a management workstation of SNMP requests that do not carry a valid read (Get) or write (Set) community string.
Write manager names. Identify which management workstations are allowed to issue write (Set) requests to the FastHub. Either the name or IP address of the management workstation can be entered. You can define up to four workstations. If no name or address is defined, then any management workstation can set the MIB objects.
Trap manager names. Identify which management workstations receive SNMP traps (alerts) from the FastHub. Either the name or IP address of the management workstation can be entered. You can define up to four workstations. If no name or IP address is defined, the FastHub does not send any traps.
Trap manager community strings. Enter the community string that accompanies an SNMP trap sent to each trap management workstation. The community string serves as a password to authenticate messages sent between the FastHub and the management workstation.
Exit. Return to Main Menu.
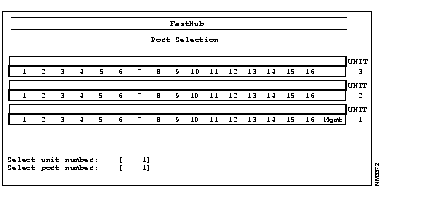
When you select the Port Configuration menu, first the Port Selection screen (see Figure 4-10) is displayed. Enter the desired unit number and port number. If you select port 1 on unit 1, the Port Configuration menu is displayed (see Figure 4-11).
Use the Port Configuration menu to enable or disable ports and display port statistics.
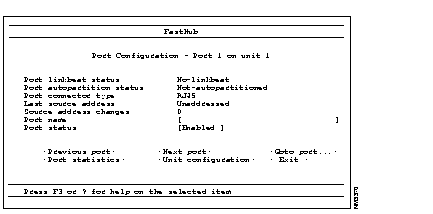
Port linkbeat status. Indicates whether link pulses are being received by this port.
Port autopartition status. Indicates whether the port is currently autopartitioned. Autopartitioned ports are automatically reconnected when the fault is rectified. Frequent partitions can indicate that the port is not terminated correctly or a connected device is faulty.
Port connector type. Indicates the port connector type.
Last source address. Indicates the MAC address of the last frame received at this port.
Source address changes. Indicates the number of different source addresses received at this port.
Port name. Enter a name for a designated port.
Port status. Enable or disable the port. A disabled port does not transmit or receive.
Previous port. Go to the Port Configuration screen for the port numerically before this port.
Next port. Go to the Port Configuration screen for the port numerically after this port.
Goto port.... Go to the Port Configuration screen for a specific port.
Port statistics. View the Port Statistics Report for the currently selected port. The Port Statistics Report presents frame transmit and receive statistics. See the "Port Statistics Report" section in this chapter.
Unit configuration. Go to the Unit Configuration menu.
Exit. Return to Main Menu.
Use the Unit Configuration menu (see Figure 4-12) to do the following:
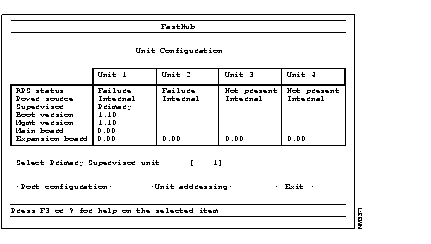
RPS status. Indicates whether an RPS is present and operational.
Power source. Indicates whether the power source is an RPS or the FastHub internal power supply.
Supervisor. Displays the unit number of the unit with the primary NMM.
Boot version. Displays the version number of the bootstrap firmware on the primary NMM.
Mgmt version. Displays the version number of the management firmware on the primary NMM.
Main board. Displays the revision number of the main board.
Expansion board. Displays the revision number of the port expansion module.
Select Primary Supervisor unit. Identify a unit's NMM as the primary NMM.
Port configuration. Go to Port Configuration menu (via Port Selection screen).
Unit addressing. Go to the Unit Addressing Report.
Exit. Return to Main Menu.
When you select the Port Statistics Report, first the Port Selection screen (see Figure 4-13) is displayed. Enter the desired unit number and port number. If you select port 1 on unit 1, the following Port Statistics Report screen is displayed (see Figure 4-14).
Use the Port Statistics Report selection to display port statistics for individual ports. The Port Statistics Report presents frame transmit and receive statistics. You cannot modify any parameters through this report.
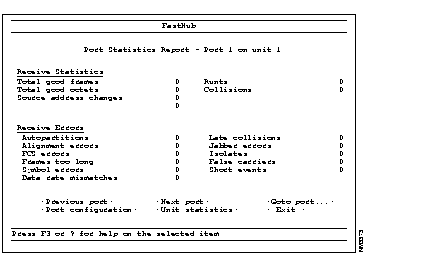
Total good frames. Total number of readable frames received by the port.
Total good octets. Total number of octets (bytes) received as part of good frames by the port.
Source address changes. Number of different source addresses received at this port.
Runts. Frames that are smaller than the minimum frame size for IEEE-802.3 standard frames. Runt frames typically are caused by collision fragments and are propagated through the network (runts are a normal part of IEEE 802.3 networks). If the number of runt frames exceeds the number of collisions, there is a problem with a transmitting device. Some protocols can also cause runt frames.
Collisions. Occur when two devices attempt to transmit at the same time (collisions are a normal part of 802.3 networks). If the collision count suddenly increases without an accompanying general increase in network traffic, you probably have a faulty device on your network. Check port collision statistics to find the port with the largest number of collisions. Ensure that the device connected to this port is operational and not in full-duplex mode.
Autopartitions. Number of times the unit has automatically partitioned the segment attached to this port. Autopartitioned ports are automatically reconnected when the fault is rectified. Frequent partitions indicate that the port is not terminated correctly or that a connected device is faulty.
Alignment errors. Total number of alignment errors at the port. Alignment errors occur if all bytes are not received whole. Check the cable and the connected device. Verify the network configuration; see the "Making Network Connections" chapter, and ensure that cabling distances have not been exceeded and that the number of repeaters in the network does not exceed the maximum allowed.
FCS errors. Frame Check Sequence errors indicating that frames of data are being corrupted during transmission; this number should be a very small percentage of the total data traffic. Check the cable and the connected device. Verify the network configuration; see the "Making Network Connections" chapter, and ensure that cabling distances have not been exceeded and that the number of repeaters in the network does not exceed the maximum allowed.
Frames too long. Frames that exceed the maximum size for 802.3 frames. The frame might have been corrupted during transmission. Some network protocols can cause these frames.
Symbol errors. Total number of frames of valid length with at least one occurrence of an invalid data symbol.
Data rate mismatches. Number of frames whose timing no longer matches the transmit frequency. Check the transmitting device.
Late collisions. Collision outside the collision domain. These might occur if you have an oversized network or a segment that is longer than prescribed in 802.3. Verify the network configuration; see the "Making Network Connections" chapter and ensure that cabling distances have not been exceeded and that the number of repeaters in the network does not exceed the maximum allowed.
Jabber errors. Occur when data packets exceed the lengths prescribed in 802.3. Check port collision statistics to find the port with the largest number of jabber errors. Ensure that the device connected to this port is operational and that the connecting cable is not faulty.
Isolates. The number of times the port automatically isolates due to false carrier events. This is generally caused by a faulty cable.
False carriers. This statistic is generated when port cables are connected or disconnected, or when connected devices are powered on and off. It can also indicate a faulty cable.
Short events. Short events are smaller than runt frames. They often indicate network problems caused by externally generated noise. Check cable routing and reroute as necessary.
Previous port. Go to the Port Statistics Report for the port numerically before this port.
Goto port.... Go to the Port Statistics Report for a specific port.
Next port. Go to the Port Statistics Report for the port numerically after this port.
Port configuration. Go to the Port Configuration menu for the current port.
Unit statistics. View the Unit Statistics Report for frame transmit and receive statistics for the current unit. See the "Unit Statistics Report" section in this chapter.
Exit. Return to Main Menu.
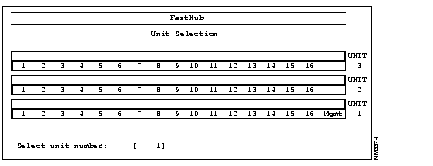
When you select the Unit Statistics Report, first the Unit Selection screen (see Figure 4-15) is displayed. Enter the desired unit number. If you select unit 1, the following Unit Statistics Report screen is displayed (see Figure 4-16).
Use the Unit Statistics Report selection to display port statistics for individual units. The Unit Statistics Report presents frame transmit and receive statistics. You cannot modify any parameters through this report.
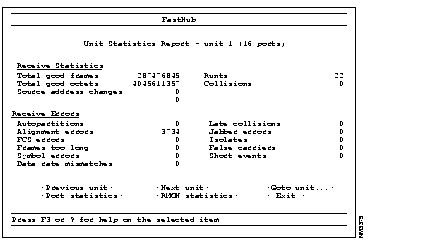
Total good frames. Total number of readable frames received by the unit.
Total good octets. Total number of octets (bytes) received as part of good frames by the unit.
Source address changes. Number of different source addresses received by this unit.
Runts. Frames that are smaller than the minimum frame size for 802.3 frames. Runt frames are typically caused by collision fragments and are propagated through the network (runts are a normal part of 802.3 networks). If the number of runt frames exceeds the number of collisions, there is a problem with a transmitting device. Some protocols can also cause runt frames.
Collisions. Occur when two devices attempt to transmit at the same time (collisions are a normal part of 802.3 networks). If the collision count suddenly increases without an accompanying general increase in network traffic, you probably have a faulty device on your network. Check port collision statistics to find the port with the largest number of collisions. Ensure that the device connected to this port is operational and not in full duplex mode.
Autopartitions. Number of times the unit has automatically partitioned the segments attached to its ports. Autopartitioned ports are automatically reconnected when the fault is rectified. Frequent partitions indicate that a port is not terminated correctly or a connected device is faulty.
Alignment errors. Total number of alignment errors at the unit. Alignment errors occur if all bytes are not received whole. Check the cable and the connected device. Verify the network configuration; see the "Making Network Connections" chapter, and ensure that cabling distances have not been exceeded and that the number of repeaters in the network does not exceed the maximum allowed.
FCS errors. Frame Check Sequence errors indicating that frames of data are being corrupted during transmission; this number should be a very small percentage of the total data traffic. Check the cable and the connected device. Verify the network configuration; see the "Making Network Connections" chapter, and ensure that cabling distances have not been exceeded and that the number of repeaters in the network does not exceed the maximum allowed.
Frames too long. Frames that exceed the maximum size for 802.3 frames. The frame might have been corrupted during transmission. Some network protocols can cause these frames.
Symbol errors. Total number of frames of valid length with at least one occurrence of an invalid data symbol.
Data rate mismatches. Number of frames whose timing no longer matches the transmit frequency. Check the transmitting device.
Late collisions. Collisions outside the collision domain. These might occur if you have an oversized network or a segment that is longer than prescribed in 802.3. Verify the network configuration; see the "Making Network Connections" chapter, and ensure that cabling distances have not been exceeded and that the number of repeaters in the network does not exceed the maximum allowed.
Jabber errors. Occur when data packets exceed the lengths prescribed in 802.3. Check port collision statistics to find the port with the largest number of jabber errors. Ensure that the device connected to this port is operational and that the connecting cable is not faulty.
Isolates. Number of times the unit ports automatically isolate due to consecutive false carrier events. This is generally caused by a faulty cable.
False carriers. This statistic is generated when port cables are connected or disconnected, when connected devices are powered on and off, or it might indicate a faulty cable.
Short events. Short events are smaller than runt frames. They could indicate network problems caused by externally generated noise. Check cable routing and reroute as necessary.
Previous unit. Go to the Unit Statistics Report for the unit numerically before this unit.
Next unit. Go to the Unit Statistics Report for the unit numerically after this unit.
Goto unit.... Go to the Unit Statistics Report for a specific unit.
Port statistics. Go to the Port Statistics Report (via the Port Selection screen).
RMON statistics. View the stack (RMON) Statistics Report for frame and receive statistics for the entire hub stack. See the "Stack (RMON) Statistics Report" section in this chapter.
Exit. Return to Main Menu.
Use the Stack (RMON) Statistics Report selection (see Figure 4-17) to display frame and receive statistics for the entire hub stack. You can also clear hub stack statistics through this report.
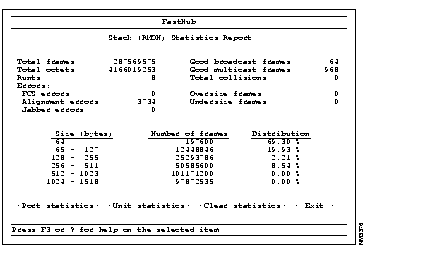
Total frames. Total number of readable frames received by the hub stack. This is a good indication of the total amount of valid data traffic passing through the hub stack.
Total octets. Total number of octets (bytes) received as part of good frames by the hub stack.
Runts. Frames that are smaller than the minimum frame size for 802.3 frames. Runt frames typically are caused by collision fragments and are propagated through the network (runts are a normal part of IEEE 802.3 networks). If the number of runt frames exceeds the number of collisions, there is a problem with a transmitting device. Some protocols can also cause runt frames.
Good broadcast frames. Total number of broadcast frames received by the hub stack.
Good multicast frames. Total number of multicast frames seen at the hub stack.
Total collisions. Total number of collisions seen at the hub stack. Collisions occur when two devices attempt to transmit at the same time (collisions are a normal part of 802.3 networks). If the collision count suddenly increases without an accompanying general increase in network traffic, you probably have a faulty device on your network. Check port collision statistics to find the port with the largest number of collisions. Ensure that the device connected to this port is operational and not in full duplex mode.
FCS errors. Frame Check Sequence errors indicating that frames of data are being corrupted during transmission; this number should be a very small percentage of the total data traffic. Check the cable and the connected device. Verify the network configuration; see the "Making Network Connections" chapter, and ensure that cabling distances have not been exceeded and that the number of repeaters in the network does not exceed the maximum allowed.
Alignment errors. Total number of alignment errors for the hub stack. Alignment errors occur if all bytes are not received whole. Check the cable and the connected device. Verify the network configuration; see the "Making Network Connections" chapter, and ensure that cabling distances have not been exceeded and that the number of repeaters in the network does not exceed the maximum allowed.
Jabber errors. Occur when data packets exceed the lengths prescribed in 802.3. Check port collision statistics to find the port with the largest number of jabber errors. Ensure that the device connected to this port is operational and that the connecting cable is not faulty.
Oversize frames. Total number of frames that exceed the maximum size for 802.3 frames. The frames might have been corrupted during transmission. Some network protocols can cause these frames.
Undersize frames. The number of frames that are less than 64 octets long but are otherwise well formed.
Port statistics. Go to Port Statistics Report (via Port Selection screen).
Unit statistics. Go to Unit Statistics Report (via Unit Selection screen).
Clear statistics. Clears all statistics in the hub stack.
Exit. Return to Main Menu.
When you select the Unit Addressing Report, first the Unit Selection screen (see Figure 4-18) is displayed. Enter the desired unit number. If you select unit 1, the following Unit Addressing Report screen is displayed (see Figure 4-19).
Use the Unit Addressing Report selection to display the port addresses for selected units. You cannot modify any parameters through this report.
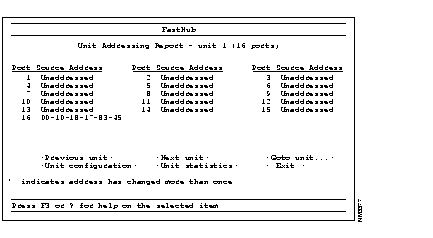
Port. Indicates port number on selected unit.
Source Address. Source address of port.
Previous unit. Go to the Unit Addressing Report for the unit numerically before this unit.
Next unit. Go to the Unit Addressing Report for the unit numerically after this unit.
Goto unit.... Go to the Unit Addressing Report for a specific unit.
Unit configuration. Go to Unit Configuration menu.
Unit statistics. Go to the Unit Statistics Report.
Exit. Return to Main Menu.
The Help selection provides information on FastHub management console keyboard use, as described in the section "Using the Keyboard," earlier in this chapter.
|
|