This chapter provides instructions for using the NMT interface, presents an overview of the modeling process, and lists NMT commands that update or extract information from NMT configuration files. This chapter contains the following sections:
The NMT designs a network based on your input. Using your knowledge of the network you want to design, the NMT helps you identify the hardware you need, estimate the payback period for the investment, and presents options for increasing bandwidth, improving reliability, and decreasing costs.
To use the NMT, you need to have the following information:
- The current network topology, including the protocols used and the kind of backbone
- Whether you are modeling an internal network or one that will generate revenue
- Whether more emphasis should be placed on making the network low-cost or high-performing
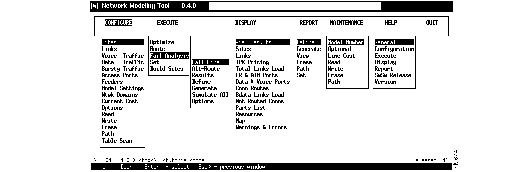
The menus in the NMT design window contain selections for inputting data that describes the existing or proposed network. These menus also provide selections for generating optimized configurations and many different types of reports. (See Figure 2-1.) The menus are as follows:
- Configure--Contains choices for describing the network model, including site names, links, and traffic types.
- Execute--Provides choices for optimizing and analyzing the network model.
- Display--Shows predefined reports describing the sites, links, required hardware, error messages and warnings, and much more. Includes a map tool selection for creating a graphical representation of your network.
- Report--Provides options for generating, defining, and displaying reports.
- Maintenance--Includes selections for modifying prices and part names and for specifying line costs.
- Help.
- Quit.
Figure 2-1: NMT Design Menu (All Menu Options Displayed)
When you highlight a menu item, a one-line description of the selection is displayed beneath the menu.
To select a top-level menu item in the NMT design window, use the left and right arrow keys. Press Enter to access a submenu. Select submenu entries with the up or down arrow key or by typing the first letter of the submenu entry. To exit from a table or menu, press Escape.
The NMT has many keyboard commands to help you create and revise configuration tables and reports. Table 2-1 lists the Sun workstation key assignments used for editing data in the NMT.
Table 2-1: Sun Key Assignments
| Key
| Function
| Description
|
|---|
| F1
| Field help
| Text description of the current field.
|
| F2
| Window help
| Table description of special keys.
|
| F3
| Copy line
| Used only in table edit forms.
|
| F4
| Repeat line
| Used only in table edit forms.
|
| F5
| Wrap line/special
| Scroll right for additional table columns.
|
| F6
| Clear end-of-field
| Clears one field in a table.
|
| F7
| Delete line
| Removes one table entry.
|
| F8
| Insert line
| Inserts a table entry below cursor.
|
| F9
| Undelete line
| Restores last deleted line above the cursor.
|
| F10
| Cancel
| Exits a table without checking data. Exits the Configure menu, deleting all table entries that have illegal data.
|
| Up Arrow
| Previous line
|
|
| Down Arrow
| Next line/Insert row
| Inserts default field values for new rows.
|
| Left Arrow
| Previous Field
|
|
| Right Arrow
| Next Field
|
|
| Page Up
| Previous Page
|
|
| Page Down
| Next Page
|
|
| Home
| First Page, first row
|
|
| End
| Last page, last line
|
|
| Ctrl <left arrow>
| Left one space
|
|
| Ctrl <right arrow>
| Right one space
|
|
| Help, F12
| Choices
| Lists choices for the selected field. Lists of choices are available for most fields that accept three or more non-numeric values.
In the Site field, you choose a Site by pressing Help (or F12) and then using the up or down arrows to scroll through the site names; press enter to select a site.
|
| Esc
| Exit
| Exits a table or menu and, in some cases, checks the data in the table. If you are not at the first screen of the table, Escape brings you to the previous screen.
|
| Ctrl-j
| Line Number
| Reports current table entry. Allows you to go to a specific table entry.
|
Note You can modify function key definitions by editing the key definitions in the file NMT.ad (in the NMT program directory). You should copy this file before editing it.
This section provides general information about starting the NMT; getting help; building, saving, and optimizing configurations; and generating reports.
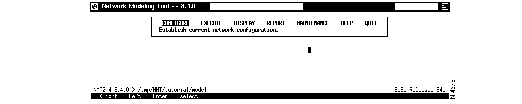
Start the NMT by entering the command nmt (from a UNIX platform). This launches an xterm window for the NMT interface. The NMT design window opens (Figure 2-2).
Figure 2-2: The NMT Design Window
Online Help
The NMT has several kinds of online help. The Help menu provides information about how to use the program and describes many of the menus and menu items in the NMT. You can get additional help as follows:
- Pressing the F1 key. If you are unsure what data to enter when the cursor is in a field of a table, you can press the F1 key to display a help screen that lists and describes the options for that field.
- Pressing the F2 key. This provides a description of the window editing and cursor capabilities of the function keys for a selected table.
- Highlighting an item in a menu, which displays a one-line description.
- If you enter an unacceptable value (for example, IXG instead of IGX) into an NMT field, the system beeps and an explanation is displayed at the bottom of the window.
An NMT configuration consists of data that describes the network. Configuration data is used by the NMT to develop a least-cost model. Configurations are created by revising tables accessed from the Configure menu. These tables describe sites, links, traffic types, and more. Figure 2-3 shows an example of a configuration table.
Figure 2-3: Sites Table

You can either input or import a configuration.
- To input a configuration, you enter data into tables accessed from the Configure menu. For information about inputting a configuration, refer to the section "Keyboard Commands" earlier in this chapter, and see the chapter "Modeling a Simple Network," which provides a step-by-step example of inputting a configuration.
- To import data from StrataView Plus, see the chapter "Configuration Extraction Tool"; to import (or export) WANDL files, see the chapter "Third-Party Interface"; to import (or export) Microsoft Excel files, see the chapter "SpreadSheet Interface."
For descriptions of the fields contained in the Configure menu selections, refer to the appendix "Configuration Tables and Fields."
Note The NMT
assumes that the version of the switch software you are using is the same as that of the NMT software. If that is not the case, select Model Settings from the Configure menu and specify the switch software version you are using by entering a release number next to Network Parameter Switch Software Release. This parameter dictates whether the model uses new IGX switch features in Release 8.2.x or new BPX switch features in Release 8.4.x. For advanced modeling, enter 899 to model networks that use Release 8.2.x, 8.4.x, and some 9.x features.
You should save your configuration regularly. The directory path is shown in the bottom left of the window. When you read in configuration files, the path is updated to include the current filename. You can also change the path to read and store files in other directories.
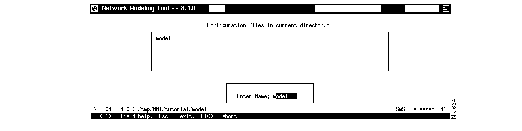
You save a configuration by selecting Write from the Configure menu, entering a name in the Enter Name dialog box, and pressing Enter. (See Figure 2-4.)
Figure 2-4: File Save Window
There are several other file-saving choices in the Configure menu:
- Select Path if you want to save, retrieve, or delete a file from a path other than the default.
- Select Erase to choose a configuration file to delete.
- Select Read to choose a configuration file to read.
The NMT models your configuration when you select one of the options under the Execute menu.
If there is any problem with your configuration, a message box displays the following message: "New warning messages generated. Check your warning browser." To go to the warning browser, select Warnings & Errors from the Display menu.
The NMT generates three types of warning messages:
- I--Informational messages generally indicate that site or link parameters have been modified to comply with user entered data.
- W--Warning messages are generally displayed when the NMT modifies connection data.
- E--Error message are generally displayed when the NMT cannot create a topology because of incorrect data.
An example of warning output is shown in Figure 2-5.
Figure 2-5: Example of NMT Warning Output

The NMT does automatic error checking in the following circumstances:
- When you exit a data entry screen, the NMT automatically performs a line-by-line check of the data in your table.
- When you exit the Configure menu, the NMT checks your data again and, in many cases, makes corrections. If the NMT makes any changes or finds any errors, it generates information, warning, or error messages as needed. When this happens, you are instructed to select Warnings & Errors from the Display menu.
Note If you are working with a large configuration, you may want to exit the Configure menu without having the NMT perform a line-by-line check. To do this, press the F10 key instead of Escape key.
- When you select Route, Optimize, or Build Sites from the Execute menu, the NMT checks your data and may make corrections. If the NMT makes any changes or finds any errors, it generates information, warning, or error messages as needed. When this happens, you are instructed to select Warnings & Errors from the Display menu.
To thoroughly check all configuration tables, select Table Scan from the Configure menu.
The NMT provides several tools for optimizing network models that allow you to create a least-cost topology with selected redundant links. You can access the following commands from the Execute menu in the Network Design Tools window.
Optimize
When you select Optimize from the Execute menu, the NMT processes your configuration to design a least-facilities-cost network. The Optimize command eliminates any unused links (links that are not used for routing traffic) from the topology. Although the unused links are eliminated from the topology, they remain in the Links table for possible later use. The process works as follows:
- The system calculates all possible topologies and selects the one in which all traffic is routed at the lowest possible cost. During this process, the Optimizing Topology message box is displayed. The message box displays a running tally of the number of topologies tried, the last two most recent costs, and the least cost so far.
- The NMT builds the sites using the topology produced in the previous step to compile a parts list. During this process the Building Sites message box is displayed, which shows the name of site currently being built.
- The connections are routed and the complete path is verified. During this process the Routing Connections message box displays the total number of network connections and maintains a running tally of the number of connections successfully routed.
- The program generates several reports. For more information on displaying reports, see the section "Generating Reports" later in this chapter.
You can stop the optimize process by pressing Escape. If you press Escape during the first step when the system is calculating all the possible topologies, you are given the option to cancel all processes or continue with the second process using the best topology found so far.
If the NMT approach to optimization is insufficient, consider using the TPI to translate your network into WANDL format. WANDL offers several different optimization methods. (See the chapter "Third-Party Interface.")
Route
Selecting Route from the Execute menu finds routes by using the same AutoRoute algorithm that is used in the switches. Only those links that have a Links table Keep field value of 1 or more are used in the topology. (The Keep field in the Links table tells the system which links must be part of the final topology, even if they have no traffic passing through them.) This selection performs two processes: it builds sites and routes connections.
Selecting Fail Analysis from the Execute menu allows you to create a situation where one or more lines fail. You can also generate a situation where the lines are failed one at a time (see the Simulate All menu choice). By failing a line, you can force the NMT to create alternative routes; the NMT does this by using the AutoRoute algorithm.
Using this algorithm, the NMT can compute which lines have enough extra bandwidth, according to values in the configuration, to support extra traffic if a line goes down. To conduct a fail analysis, you must first select Route from the Execute menu.
The Fail Analysis submenu has the following choices:
- Fail Line: Calls up a table that lists the links in your configuration. In the Failed field, you can instruct the NMT to fail a link by changing N to Y.
- Alternate Route: Flags connections that you failed in the Fail Line window and tries to find alternative routes. It outputs its results to the following tables in the Display menu: Total Links Load, Routes, and No Routes.
- Results: Displays reports that summarizes the alternative routes.
- Define: See the section "Generating Reports" later in this chapter.
- Generate: See the section "Generating Reports" later in this chapter.
- Simulate All: Automatically fails each line one at a time and produces a report. When you select Simulate All, you are asked to enter a name for the report; the NMT fails each link one at a time, and you can display the report by selecting View from the Report menu.
- Options: Allows you to specify whether the system should ignore IMATM trunks or virtual trunks when performing a fail analysis.
If all your connections do not reroute as a result of link failure or a set of link failures, you may want to add additional capacity to your links. You can do this by increasing the size of existing links, the link count, or adding new links. You can use TPI and WANDL to help design a resilient topology.
Set
Selecting Set from the Execute menu allows you to specify the model parameter settings listed in Table 2-2.
Table 2-2: Execute Menu Model Parameter Settings
| Setting
| Defaults
| Description
|
|---|
| Optimize LDI Ports
| Y
| If yes, NMT tries to optimize the cost of the LDP cards by using lower cost LDP-4 cards instead of LDP-8 cards.
If no, NMT only uses LDP-8 cards. You can still explicitly call for an LDP card with a specific line count.
|
| Group Bursty Conns.
| Y
| If yes, NMT groups connections when their number exceeds the maximum number of LCONS. An LCON is a resource required for each network route with similar properties. The grouping of connections allows more routed connections in a network.
If no, NMT does not group connections and fails to build a site when a grouping is required.
|
| Distribute Groups
| Y
| If yes, NMT optimizes the grouping of connections to smooth network loading.
If no, NMT does not optimize grouping.
|
| Map Link Load
| Y
| If yes, NMT writes a file for the Motif Map to read whenever you run Route or Optimize.
If no, NMT does not write this file. You usually leave this setting set at Y.
|
| Use Hub ID
| Y
| If yes, NMT assigns slots and ports based on hub and feeder IDs.
If no, NMT treats all ID fields as though they were zero filled, and provisions links and connections using its own algorithms.
|
| Obey Hub ID
| Y
| If yes, the program follows the convention of the hub ID, for example, if the hub ID is 4.2, the program assigns the connection to slot 4, port 2. If Use Hub ID is set to yes, always set this to yes.
If no, NMT uses an older method of labeling slots and keeping all connections together, but not necessarily at the true physical location.
|
| Hub ID Over Redundancy
| N
| If yes, the system eliminates the redundant card if another card has requested the hub ID of the backup card.
If no, the system gives backup cards precedence over another card that was assigned the same port. In this case, NMT overrides the hub ID and moves one of the connections to a different location.
|
| New Share with ID
| N
| If yes, NMT allows connections IDs of zero to share ports with connections having IDs other than zero.
If no, NMT does not allow this.
|
| Share Redundancy
| Y
| If yes, nonredundant connections can share cards that are used on redundant connections, essentially getting redundancy for free.
If no, nonredundant connections cannot share these cards, and are provisioned by a separate nonredundant service module.
|
| Use SRM-3T3 on AXIS
| N
| If yes, provide an SRM-3T3 service redundancy module on all AXIS shelves.
If no, NMT uses the standard SMR.
|
| Strict Routing Checking
| N
| If yes, the NMT checks that a link is not used for incompatible traffic types.
If no, NMT does not check this.
|
| Store Link Q Depths
| N
| If yes, NMT assumes link queue depths are 0 (not specified) and assigns default values.
If no, NMT assumes the depths are specified. Choose Links from the Configure menu and press F5 to get to the field where Q Depths are specified.
|
| Store Preferred Route
| N
| If yes, NMT sets the preferred routes to the currently modeled routes.
If no, NMT does not do this and leaves the file as you entered it. Choose a traffic type (e.g., voice or data) from the Configure menu and press F5 one or two times to get to the field where preferred routes are set.
|
| Store Receive Rates
| N
| If yes, NMT sets the receive rate to the maximum value. This field is set only for those cards for which NMT models the receive rate --AIT, ALM, BTM, and BXM.
If no, NMT does not set the receive rate to the maximum value.
|
Build Sites
Selecting Build Sites from the Execute menu allows you to provision the sites without routing the connections. You have the option of building all sites or one specific site. When building all sites, if one fails to build, you are given the option of continuing or halting.
A site will fail to build when at least one of the switch resources at the site is exceeded and all links and connections cannot be provisioned.
The NMT can generate a variety of reports that describe the optimized network. Use the Display menu to see standard reports. Use the Report menu to create a custom report.
The Display menu commands display many standard reports, described in Table 2-3. In addition, the NMT can create a network map that provides a graphical representation of the network topology.
Table 2-3: Reports Available from the Display Menu
| Display menu
| Contents
|
|---|
| View Results
| Display summary of modeling results.
|
| Sites
| Site names; system, options, and total cost per site.
|
| Links
| Link from/to, media (for example, terrestrial, satellite), trunk type, number of connections, trunk card type, and so forth.
|
| IPX Pricing
| Current summary of total design costs: equipment, installation, program management, link installation.
|
| Total Links Load
| Static load estimates by traffic type for each link in the network.
|
| FR & ATM Ports
| Site name, connection type (for example, FRM-V35), slot number, port number, port speed (cells or packets per second), SUM MIN (port load).
|
| Data & Voice Ports
| Site name, connection type (for example, SDP-V35), slot number, port number, port speed.
|
| Conn Routes
| Connection to/from, number of connections, connection type (for example, FR, 56), path number of hops, delay time in msec for voice and NTS connections.
|
| Bdata Link Loads
| Bursty data queue loads.
|
| Not Routed Conns
| Unrouted connections and reason that caused connection to fail router.
|
| Parts List
| Listed by site, including part number, description, quantity, cost per site.
|
| System Unit Resources
| Graphical display of each node's card cage showing front cards and back cards.
|
| Map
| Network topology map. See below.
|
| Warnings & Errors
| Warnings and error messages.
|
Using the Map Tool
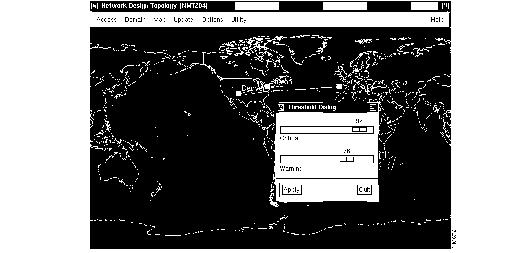
The network topology map is shown in Figure 2-6. The map provides a useful tool for visualizing your network model. The map tool
- Provides a graphical display of your topology
- Helps you conduct fail analysis
- Allows you to visualize traffic levels
The map tool includes several menus, described in Table 2-4.
Table 2-4: Map Tool Menus
| Menu Bar
| Selection
| Description
|
|---|
| Map
| Map
| Show or hide the map.
|
|
| Select
| Select a map.
|
| Update
| Update Map
| Import the latest configuration.
|
| Options
| Thresholds
| Define thresholds at which traffic is considered excessive (critical) or close to excessive (warning).
|
|
| Black and White
| Display the map in black and white.
|
| Utility
| Reset
| Clear the map.
|
|
| About
| Describes the map application.
|
|
| Save
| Save the map.
|
|
| Quit
| Close the map.
|
| Messages
| Browse Messages
| Appears only if there are error messages.
|
Note The Access, Domains and Help menus, as well as the Configure option in the Utility menu, are not enabled in this release.
To enlarge a region of the map, hold down the left mouse button and select the region of the map you want to enlarge. To move a map, hold down the middle mouse button and drag the map within the window. To reduce an enlarged map, click one or more times on the right mouse button with your cursor in the map window. To return a map to its default size, reselect the map from the Map menu.
The map tool uses color coding to help you recognize important aspects of your network topology. The color coding is described in Table 2-5.
Table 2-5: Network Topology Map Color Coding
| Color
| Node
| Link
|
|---|
| Green
| Node is functioning normally.
| Link is functioning normally and is below threshold capacity.
|
| Yellow
| Not applicable.
| Link is above minimum but below high percent tolerance.
|
| Red
| Node is not working (or is being used for failure analysis), Not all connections at this node could reroute.
| Link is above capacity threshold tolerance.
|
Figure 2-6: Example of Network Topology Map Showing Threshold Dialog Box
Creating a Graphical Display
To create a graphical display of a new configuration, perform the following steps:
Step 1 Select Map from the Display menu and drag the Map window to a suitable location on your screen. It may take several seconds for the Map window to display.
Note Select Map tool menus by using the left mouse button, except where noted.
Step 2 Choose Update from the menu bar and click on Update Map to import the most recent configuration.
Step 3 Choose Map from the menu bar in the Network Design Topology window and click on Select to choose a map appropriate to your configuration.
Step 4 Drag each node to its approximate location on the map. The node icons (colored squares) are stacked in the upper left corner of the window. Place your cursor over a node, hold down the left mouse button, and drag the node into place. Repeat this step for each node.
Step 5 To save your map, choose Utility from the menu bar and select Save.
Using the Map Tool with Fail Analysis
After performing a failure analysis, click on Update in the map window menu bar, and select Update map. Any site that did not reroute a connection for any of the link failures turns red.
Using the Map Tool to Analyze Traffic Levels
Click on the Options menu and select Thresholds. (See Figure 2-6.) The Thresholds dialog box contains two sliding bars, Critical and Warning, that allow you to define critical and warning as a percent of total bandwidth. By sliding the bar, you establish the threshold at which the amount of traffic is considered excessive (critical) or close to excessive (warning). The NMT displays excessive traffic in red, close to excessive traffic in yellow, and all other traffic in green.
Use the Report menu to define, generate, display, and save reports. The menu contains the following options:
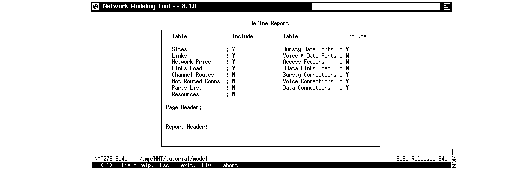
- Define Report--Select which tables to include in a report. Figure 2-7 shows the Define Report window. In this window you can specify the contents of the report and also add a page header and a report header..
- Generate a Report--Name and generate a report.
- View a Report--Select a report to display.
- Erase Report--Delete a report from the current directory.
- Path--Set the directory path.
- Set--Specify report variables, including: price (0 for normal pricing; 1 to 5 for number of years in lease); detail (Y to include intrasite links; N to exclude them); DBF (Y to create report in DBF format, as well as text format); N to create report only in text format).
Figure 2-7: Report Options
Use the Maintenance menu to revise product costs, add optional equipment (for reference purposes), and provide information about line costs. This menu also allows you to read, write, erase, and set the path for maintenance files.
Figure 2-8 summarizes the process of configuring a network model using the NMT. The work flow requires that you first input or import a configuration. When inputting a configuration, you must describe the sites before describing the links, traffic types, and any special network characteristics.
Figure 2-8: Typical NMT Operation, Condensed Flow

NMT provides commands for modifying and summarizing data in the NMT configuration (.cnf) files. (See Table 2-6.)
You should enter all commands on a UNIX command line. Most commands use the following form:
command cnffile [options]
where cnffile is the name of the NMT configuration file.
Several of the commands require additional input, such as names of output files. Before you use one of these commands, enter command -h at the UNIX prompt. This calls up help text.
Table 2-6: NMT Command Line Commands
| Command
| Description
|
|---|
| NMT_Route cnffile
| Run the NMT Route command, generating all reports.
|
| NMT_Optimize cnffile
| Run the NMT Optimize command, generating all reports.
|
| NMT_Failure cnffile
| Run the NMT Simulate All command.
|
| sniffcnf cnffile
| Read a .cnf file, and print a short summary of the network characteristics. Use this command to review old .cnf databases, summarize a file you received from another user, or check a CET extraction.
|
| sniffdbf dbffile
| Give a brief summary of the contents of a .dbf (SSI) file.
|
| rensite cnffile1 cnffile2 osite nsite
| Rename a specific site in all tables and write the resulting file.
|
| cnftrep cnffile1 cnffile2 cnffile3
| Read two .cnf files, take the Links table from one file, and all other tables from the other, and write the resulting network as a third file. An option allows the command to replace any table except for the Site table.
|
| cnfupdat cnffile1 cnffile2
| Update the .cnf file to the latest format, and perform all logical changes, such as updating hub IDs to new format, changing ATF to FTA where appropriate, and applying relevant information from previous NMT upgrades.
|
| cnfecho cnffile1 cnffile2
| Update the .cnf file to the latest format, but perform no logical changes. Also has options to sort the information in the .cnf tables.
|
| cnfexpn cnffile1 cnffile2
| Update the .cnf file, duplicating all connections where the quantity field is greater than 1. Default is bursty only, though any or all connection tables can be specified. This command is necessary if you want to do grouping and have quantity fields in the bursty table with values greater than 0.
|
| onesite cnffile1 cnffile2
| Specify one site, and extract a .cnf file with only connections and links that belong to that site. Useful for analyzing a subsection of a network.
|
