|
|

You have added devices to your network and created some views with which to generate reports. You have also generated the reports you need. Now you want to monitor the devices in your network inventory and determine their availability.
You can use the availability management features to do the following:
The following sections are presented in this chapter:
Scenario: You want to monitor device availability, but first, you must select the views .
To set views and polling options, perform the following steps:
Step 1 
Log in with administrator privileges.
Step 2 Click Admin on the button bar, then select Availability > Change Polling Options.
The Select Polled Views dialog box appears. (See Figure 5-1.)
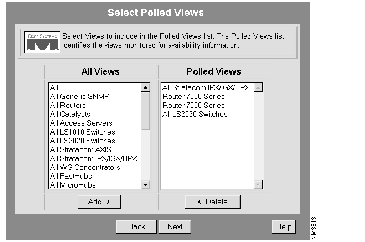
Step 3 Select the views you want to poll from the All Views list, then click Add.
Step 4 Select the views you want to delete from the Polled Views list, then click Delete.
Step 5 Click Next.
The Change Polling Options dialog box appears. (See Figure 5-2.)
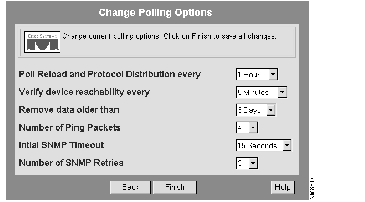
Step 6 Select values from the drop-down list boxes to change any of the polling options, then click Finish.
You can use the Reachability Dashboard to check device reachability and when it last responded. Dashboard window is updated each minute.
Scenario: You want to quickly determine the availability (or reachability) of the devices in all your views.
To view the reachability dashboard, perform the following steps:
Step 1 
Click Tasks on the button bar, then select Availability > Reachability Dashboard.
The Reachability Dashboard appears with a report for each of the views. (See Figure 5-3.)
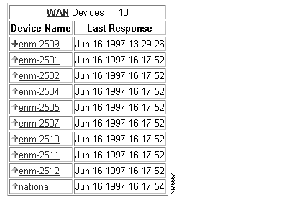
Step 2 Click the Device Name links to access the Device Center for more detailed information.
Step 3 When you are finished, click Close.
Scenario: You want to determine the overall availability of devices on your network.
To determine network availability, perform the following steps:
Step 1
Click Tasks on the button bar, then select Availability > Availability Monitor.
The Select Devices dialog box appears. (See Figure 5-4.)
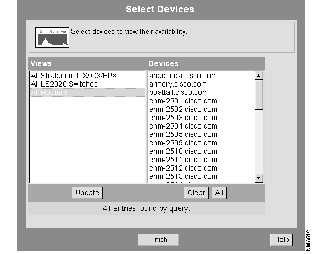
Step 2 Select All Routers in the Views column, click All in the Devices column, then click Finish.
The Availability Monitor report appears. (See Figure 5-5.)
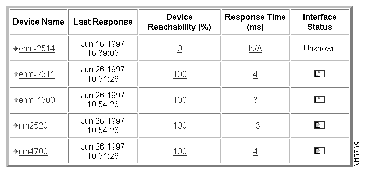
Step 3 The Availability Monitor report contains several links for each device. For more detailed device information, choose from the following links:
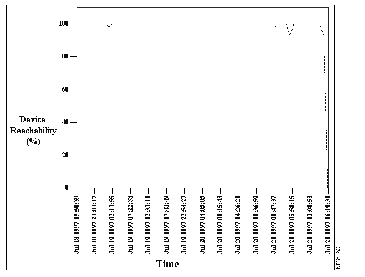
(a) Click the Device Reachability (%) links to view the corresponding Device Reachability graph.
The Device Reachability graph appears. (See Figure 5-6.)
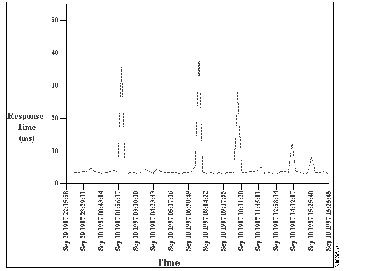
(b) Click the Response Time (ms) links to display the response time in milliseconds.
The Response Time report appears. (See Figure 5-7.) Print or save the report.
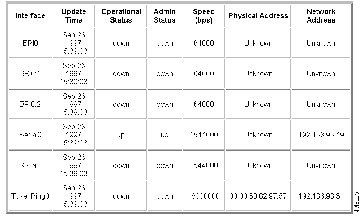
(c) Click the Interface Status links to view the Interface Details for the corresponding device.
The Interface Details report appears. (See Figure 5-8.) Print or save the report.
Scenario: Several devices on the network have crashed and reloaded overnight. You want to determine which devices reloaded and why.
To determine your reload history, perform the following steps:
Step 1
Click Tasks on the button bar, then select Availability > Reloads Report.
The Select Devices dialog box appears. (See Figure 5-4.)
Step 2 Select All from the Views column, then click All.
Step 3 Click Finish.
The Reloads Report appears. (See Figure 5-9.)
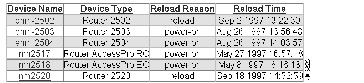
Step 4 To view the most recent reloads information for a specific period of time, select the period (for example, 1 Day) on the Reports drop-down list box, then click Reports.
A results window appears containing the most recent reloads information for the last 24 hours.
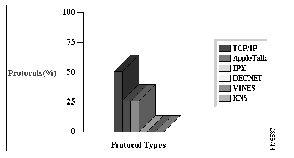
Scenario: You are preparing for a network rollout and want to determine the protocol distribution of devices on the network.
To determine the protocol distribution of a region, perform the following steps:
Step 1
Click Tasks on the button bar, then select Availability > Protocol Distribution Graph.
The Select Devices dialog box appears. (See Figure 5-4.)
Step 2 Select All, then click Finish.
The protocol distribution bar chart appears. (See Figure 5-10.)
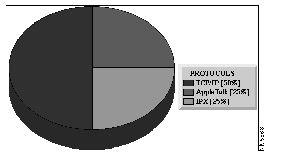
Step 3 To see the pie chart format, select Pie Chart on the Reports drop-down list box, then click Reports.
The Protocol Distribution appears. (See Figure 5-11.)
|
|