|
|

The Resource Manager syslog analysis features provide a central error-message logging system that you use to classify, sort, and integrate error messages and exceptions. You can perform the following procedures with syslog analysis:
All Resource Manager users can generate message log reports, custom reports and summaries, and severity alert reports and summaries, as follows:
The following sections are presented in this chapter:
Scenario: You want to configure a custom report to monitor several alert types.
To configure a custom report, perform the following steps:
Step 1 
Click Admin on the button bar, then select Syslog Analysis > Define Custom Report.
Step 2 The Define Custom Reports dialog box appears. (See Figure 6-1.)
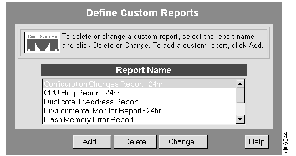
You have three options.
In this scenario, you will add a report.
Step 3 Click Add.
The Add Custom Report dialog box appears. (See Figure 6-2.)
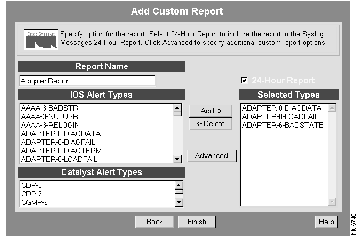
Step 4 Enter the report name, up to 64 characters long.
Step 5 Select the alerts you want reported from the Cisco IOS Alert Types and Catalyst Alert Types lists. Click Add after each selection. The selected alerts appear in the Selected Types list.
Step 6 Select the 24-Hour Report check box to add the report to the 24-Hour Reports task folder. The report will be generated when you select Tasks > 24 Hour Reports > Syslog Messages.
Step 7 To set more options, such as facility and severity codes, click Advanced. This step is optional.
Step 8 Click Finish.
A confirmation message appears informing you the report has been configured.
Step 9 To define another custom report, click Define Another.
Scenario: You want to determine which routers on your network have changed their running configurations over a specified period of time.
To view a custom report, perform the following steps:
Step 1 
Click Tasks on the button bar, then select Syslog Analysis > Custom Reports.
The Custom Reports dialog box appears. (See Figure 6-3.)
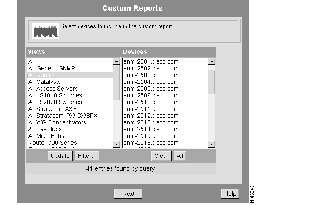
Step 2 Select All Routers from the Views column, then click All.
Step 3 Click Next.
The Select Report Name and Dates dialog box appears. (See Figure 6-4.)
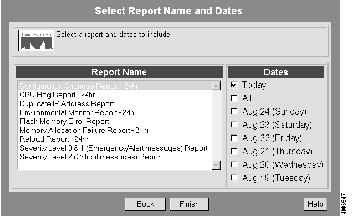
Step 4 Select the name of the report you want to view, select the date, then click Finish.
The Configuration Changes Report appears. Print the report and save it as a CSV or plain text file.
Use 24-hour reports to identify the syslog messages generated over the last 24 hours.
You can add 24-hour reports by performing the procedure for Configuring a Custom Report.
Scenario: You just came in from the field or arrived for your shift and you want to obtain a status report for the most recent syslog messages.
Click Tasks on the button bar, then select 24-Hour Reports > Syslog Messages.
The Syslog 24-Hour Report appears. (See Figure 6-5.) Click the Custom Report Name links to view report details.

Scenario: You want to obtain a snapshot of the error message severity levels for the routers on your network.
To view the severity level summary, perform the following steps:
Step 1 Click Tasks on the button bar, then select 
Syslog Analysis > Severity Level Summary.
The Severity Level Summary dialog box appears. (See Figure 6-6.)
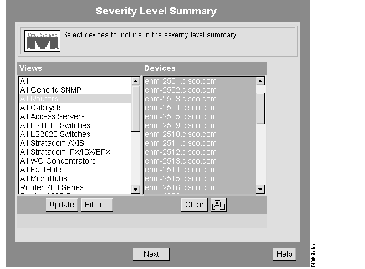
Step 2 Select All Routers in the Views column, click All in the Devices column, then click Next.
The Select Dates dialog box appears. (See Figure 6-7.)
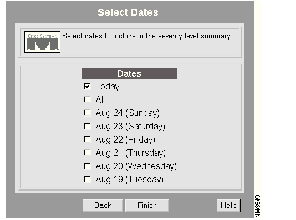
Step 3 Select Today to see the Severity Level Summary for the current day, then click Finish.
The Severity Level Summary appears. (See Figure 6-8.) Print the report and save it as a CSV or plain text file.

Step 4 Click the links to display messages logged by the device.
|
|