|
|
To aid in management, the Catalyst 2600 allows you to obtain a variety of status, statistic, and diagnostic information. This chapter provides information on the following:
For information about setting up a console session, refer to the section "Planning for Configuration and Management."
Viewing Status and Statistic Information
The Catalyst 2600 allows you to view status information and statistics for individual ports or for the Catalyst 2600 as a whole. This information is displayed on several panels that are accessible from the Status/Statistics Menu.
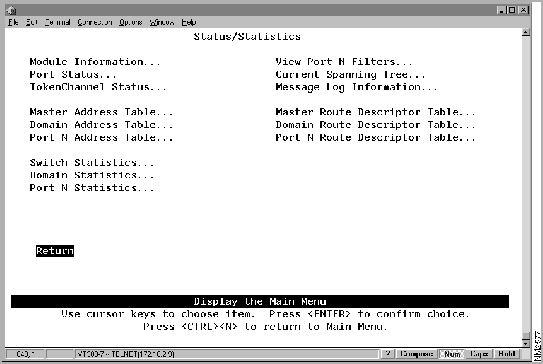
To access the Status/Statistics Menu, select Status/Statistics on the Main Menu. The Status/Statistics Menu (Figure 7-1) is displayed.
Figure 7-1 : Status/Statistics Menu Panel
You can view status information for:
Viewing Catalyst 2600 and Universal Feature Card Status
To view general information about the Catalyst 2600 and any UFCs installed, select Module Information on the Status/Statistics Menu. The Module Information panel (Figure 7-2) is displayed.
Figure 7-2 : Module Information Panel
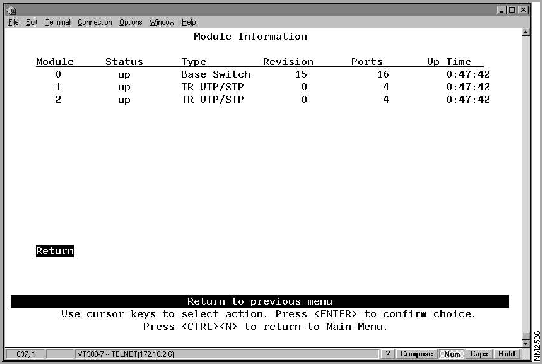
The following information is displayed on this panel:
You cannot change the information that appears on this panel.
To view status information for each port of the Catalyst 2600, select Port Status on the Status/Statistics Menu. The Port Status panel (Figure 7-3) is displayed.
Figure 7-3 : Port Status Panel
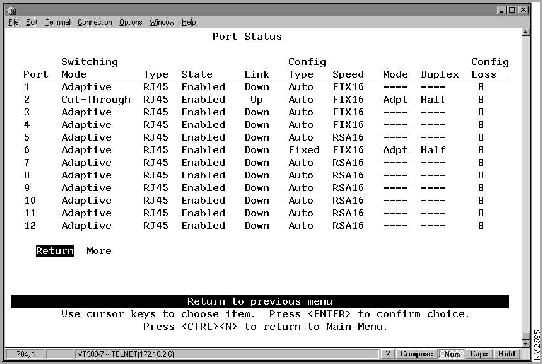
The following information is displayed on this panel:
You cannot change any information on this panel. To change any of the port parameters, refer to the section "Configuring Port Parameters."
To view status information for any TokenChannels configured in the Catalyst 2600, select TokenChannel Status on the Status/Statistics Menu. The TokenChannel Status panel (Figure 7-4) is displayed.
Figure 7-4 : TokenChannel Status Panel
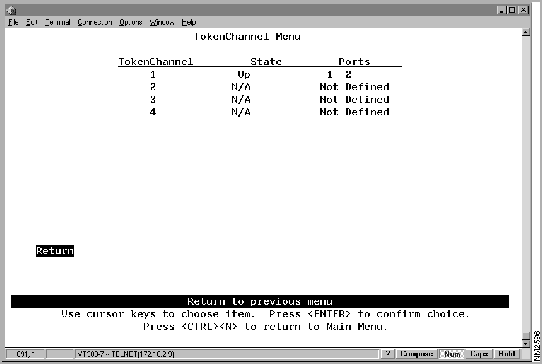
The following information is displayed on this panel:
You cannot change any information on this panel. To change any of the TokenChannel parameters, refer to the section "Configuring TokenChannels."
You can view the address tables, which are used in forwarding frames, for:
Viewing the Master Address Table
To view all entries in the master address table, select Master Address Tables on the Status/Statistics Menu. The Master Address Table panel (Figure 7-5) is displayed. The master address table can contain up to 10,000 entries.
Figure 7-5 : Master Address Table Panel
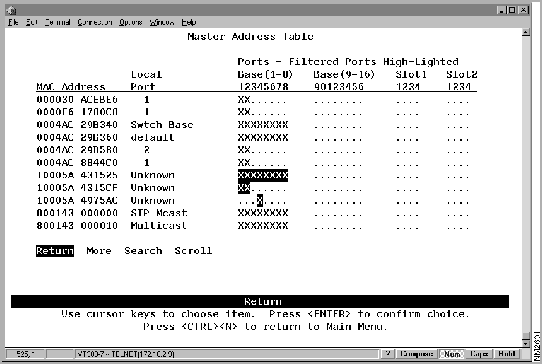
The following information is displayed on this panel:
| To | Select | Then |
|---|---|---|
| Search for a specific MAC address... | Search | Specify the address. |
Viewing the Address Table for Each Domain
To view the entries in the address table for each domain, select Domain Address Table on the Status/Statistics Menu. The Domain Address Table panel (Figure 7-6) is displayed. The entries are listed in the order in which they were encountered.
Figure 7-6 : Domain Address Table Panel
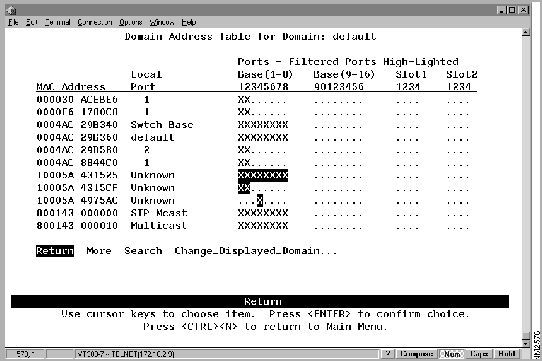
The following information is displayed on this panel:
| To | Select | Then |
|---|---|---|
| View the address table for another domain... | Change_Displayed_Domain | Specify the domain. |
| Search for a specific MAC address... | Search | Specify the address. |
Viewing the Address Table for a Specific Port
To view the entries in the address table of a specific port, select Port N Address Table on the Status/Statistics Menu and specify a port number. The Port N Address Table panel (Figure 7-7) is displayed. The port address table can contain up to 1790 entries. The entries are listed in the order in which they were encountered.
Figure 7-7 : Port N Address Table Panel
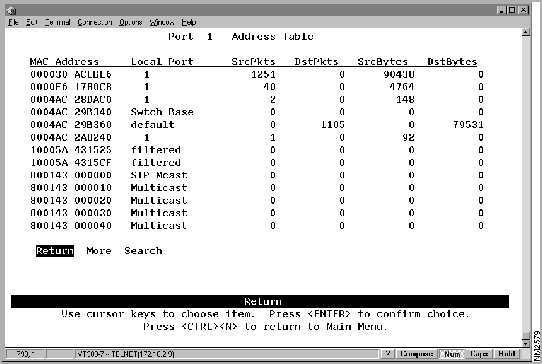
The following information is displayed on this panel:
| To | Select | Then |
|---|---|---|
| Search for a specific MAC address... | Search | Specify the address. |
You can view operating statistics for:
Viewing Catalyst 2600 Operating Statistics
To view operating statistics for the Catalyst 2600, select Switch Statistics on the Status/Statistics Menu. The Switch Statistics panel (Figure 7-8) is displayed. This panel is automatically refreshed every 10 seconds.
Figure 7-8 : Switch Statistics Panel
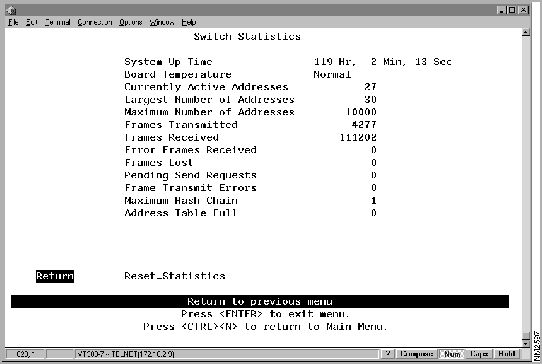
The following information is displayed on this panel:
| To | Select |
|---|---|
| Reset the counters... | Reset_Statistics |
Viewing Statistics for Each Domain
To view statistics for each domain, select Domain Statistics on the Status/Statistics Menu. The Domain Statistics panel (Figure 7-9) is displayed.
Figure 7-9 : Domain Statistics Panel
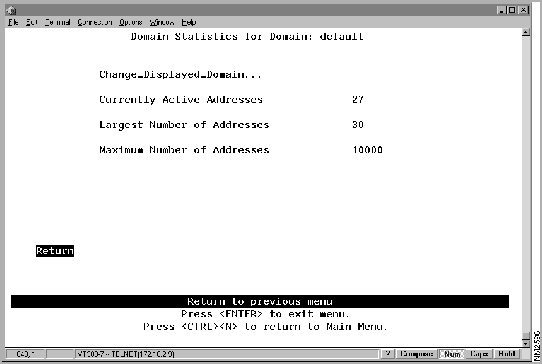
The following information is displayed on this panel:
| To | Select | Then |
|---|---|---|
| View statistics for another domain... | Change_Displayed_Domain | Specify the domain. |
Viewing Statistics for a Specific Port
To view statistics for a specific port, select Port N Statistics on the Status/Statistics Menu and specify the port number. The Port N Statistics panel (Figure 7-10) is displayed. This panel is automatically refreshed every 10 seconds.
Figure 7-10 : Port N Statistics Panel 1
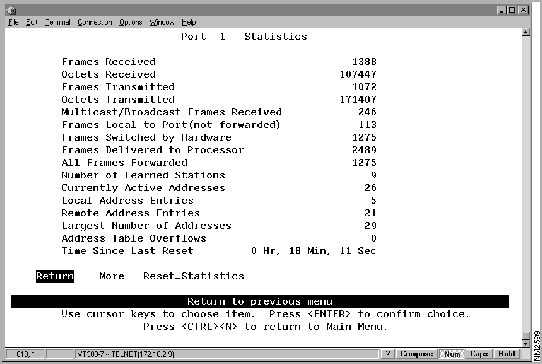
The following information is displayed on this panel:
| To | Select |
|---|---|
| View additional statistics... | More |
| Reset the counters... | Reset_Statistics |
Figure 7-11 : Port N Statistics Panel 2
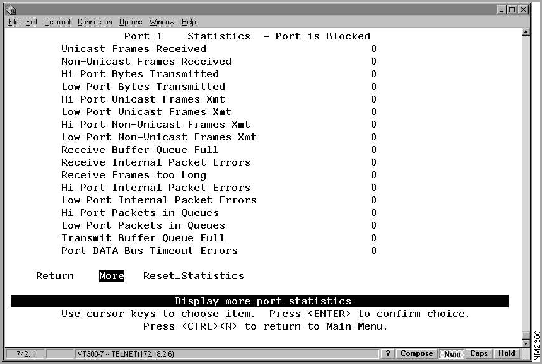
The statistics shown on this panel provide additional granularity for analyzing traffic and switch performance statistics. Some error events are counted for possible fault analysis.
| To | Select |
|---|---|
| Reset the counters... | Reset_Statistics |
| Return to the previous panel... | More |
Viewing Filters and Security Mode for a Specific Port
To display the defined filters and security mode for a specific port, select View Port N Filters on the Status/Statistics Menu. The Port N Filters panel (Figure 7-12) is displayed.
Figure 7-12 : Port N Filters Panel
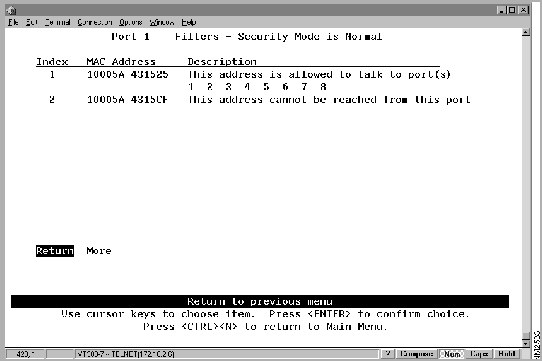
The following information is displayed on this panel:
You cannot change any information on this panel. To change the filters or security mode, refer to the section "Limiting Scope and Access."
Viewing Spanning-Tree Information for Each Domain
To display the spanning-tree parameters for each domain, select Current Spanning Tree on the Status/Statistics Menu. The Current Spanning Tree panel (Figure 7-13) is displayed.
Figure 7-13 : Current Spanning Tree Panel
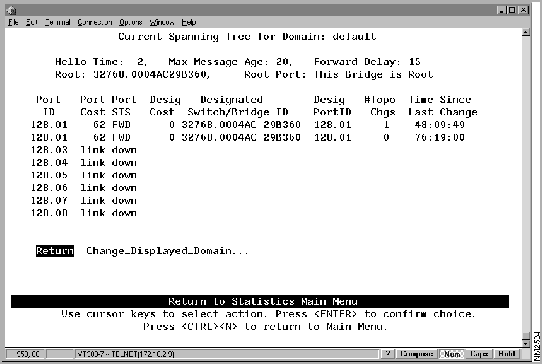
The following information is displayed on this panel:
port priority.port number
.
You cannot change any information on this panel. To change the spanning tree parameters, refer to the section "Configuring Spanning-Tree Parameters."
| To | Select | Then |
|---|---|---|
| View Spanning Tree parameters for another domain... | Change_Displayed_Domain | Specify the domain. |
To view the message log, select Message Log on the Status/Statistics Menu. The Message Log Information panel is displayed. The data on this panel is useful to technical experts in solving complex problems.
The following information is displayed on this panel:
| To | Select |
|---|---|
| Delete the contents of the message log... | Clear_Logs |
You can view route descriptors, which are used in forwarding source-routed frames, for:
Viewing the Master Route Descriptor Table
To view all the route descriptors (and their associated ports) that have been learned by the Catalyst 2600, select Master Route Descriptor Tables on the Status/Statistics Menu. The Master Route Descriptor Table panel (Figure 7-14) is displayed. These descriptors are contained within the 10,000 entries allowed for the master address table.
Figure 7-14 : Master Route Descriptor Table Panel
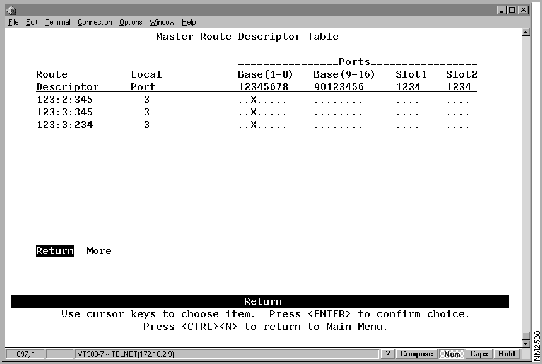
The following information is displayed on this panel:
local_segment_number:bridge_number:remote_segment_number
Viewing Route Descriptor Table for Each Domain
To view the entries in the route descriptor table for each domain, select Domain Route Descriptor Tables on the Status/Statistics Menu. The Domain Route Descriptor Table panel (Figure 7-15) is displayed.
Figure 7-15 : Domain Route Descriptor Table Panel
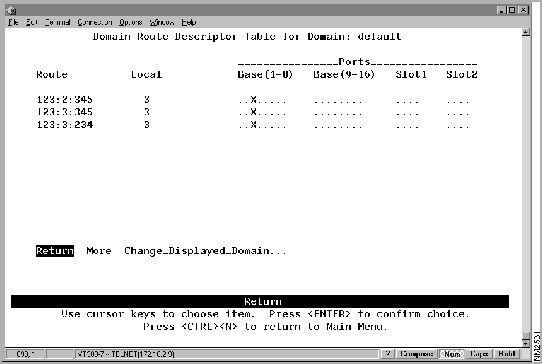
The following information is displayed on this panel:
local_segment_number:bridge_number:remote_segment_number
| To | Select | Then |
|---|---|---|
| View the route descriptor tables for another domain... | Change_Displayed_Domain | Specify the domain. |
Viewing the Route Descriptor Table for a Specific Port
To view the entries in the route descriptor table for a specific port, select Port N Route Descriptor Tables on the Status/Statistics Menu and specify a port number. The Port N Route Descriptor Table panel (Figure 7-16) is displayed. These descriptors are contained within the 1790 entries allowed for each port address table.
Figure 7-16 : Port N Route Descriptor Table Panel
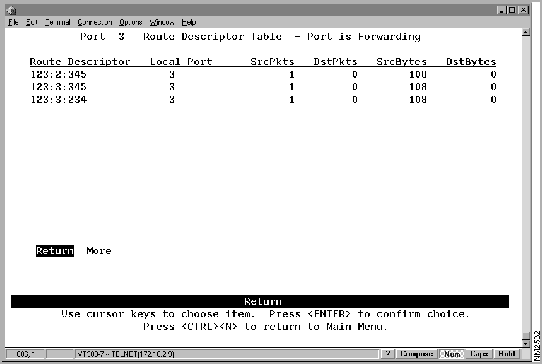
The following information is displayed on this panel:
local_segment_number:bridge_number:remote_segment_number
To allow the Catalyst 2600 to be managed by an SNMP manager, you must first configure the SNMP parameters. To view or set SNMP parameters, such as the community names, where traps are to be sent, and whether authentication failure traps should be sent, select SNMP Configuration on the Configuration Menu. The SNMP Configuration panel (Figure 7-17) is displayed.
Figure 7-17 : SNMP Configuration Panel
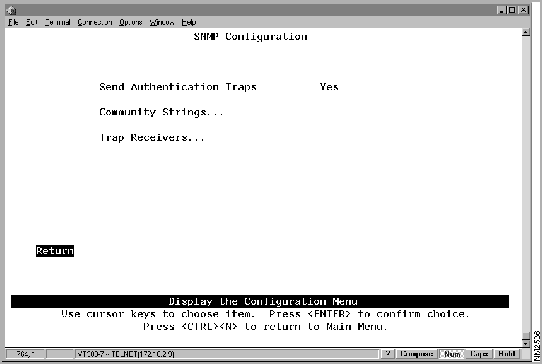
The following information is displayed on this panel:
| To | Select | Then |
|---|---|---|
| Change the current settings... | The appropriate parameter... | Specify the value. |
| View or change SNMP community names and privileges... | Community Strings | Refer to "Specifying Community Names". |
| View or change which SNMP managers are to receive traps for which domains... | Trap Receivers | Refer to "Specifying Trap Receivers". |
| Save your changes... | Return |
To view or change the community names for the domains of the Catalyst 2600, select Community Strings on the SNMP Configuration panel. The Community Strings panel (Figure 7-18) is displayed. A community name is a name associated with the Catalyst 2600 and a set of SNMP managers that are allowed to manage it with the specified privilege level.
Figure 7-18 : Community Strings Panel
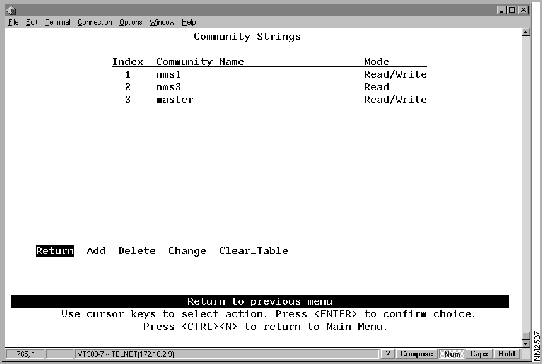
The following information is displayed on this panel:
Entries are displayed in the order in which they are entered. There is a limit of 10 community names.
| To | Select | Then |
|---|---|---|
| Add a community name... | Add | Specify the community name and privilege. |
| Change a community name or privilege... | Change | Specify the index number of the entry to be changed and enter the new information. |
| Delete a community name... | Delete | Specify the name to be deleted. |
| Delete all community names... | Clear_Table | |
| Save your changes... | Return |
To view or change the list of SNMP managers to which traps are sent, select Trap Receivers on the SNMP Configuration panel. The Trap Receivers panel (Figure 7-19) is displayed.
Figure 7-19 : Trap Receivers Panel
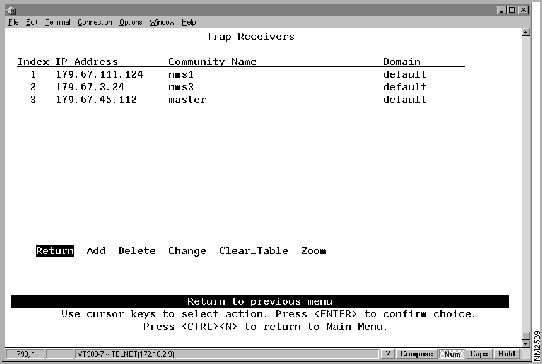
The following information is displayed on this panel:
The trap receivers list can contain a maximum of six entries.
| To | Select | Then |
|---|---|---|
| Add an entry to the list... | Add | Specify the IP address, community name, and domain. |
| Change an entry in the list... | Change | Specify the index number of the entry to be changed and enter the new information. |
| Delete an entry... | Delete | Specify the index number of the entry to be deleted. |
| Delete all entries... | Clear_Table | |
| Save your changes... | Return |
The Catalyst 2600 allows you to configure a Switched Port Analyzer port for monitoring port traffic. This Switched Port Analyzer support allows you to monitor traffic on any of the Token Ring ports using a customer-supplied monitoring device or trace tool. To configure a Switched Port Analyzer port, select Switched Port Analyzer Configuration on the Configuration Menu. The Switched Port Analyzer Configuration panel (Figure 7-20) is displayed.
Figure 7-20 : Switched Port Analyzer Configuration Panel
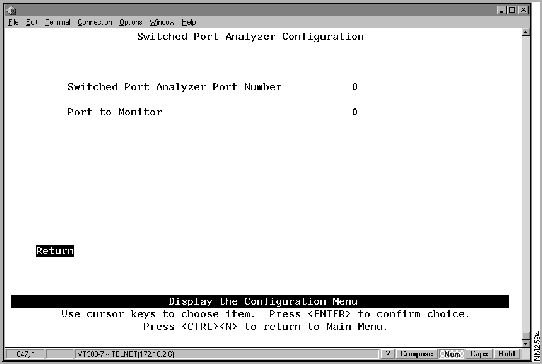
The following information is displayed on this panel:
| To | Select | Then |
|---|---|---|
| Change the current settings... | The appropriate parameter... | Specify the value. |
| Disable the Switched Port Analyzer port... | Port to Monitor | Specify 0. |
| Save your changes... | Return |
Resetting the Catalyst 2600 and Running Diagnostic Tests
To reset the switch or to obtain diagnostic information, select Reset/Diagnostics on the Main Menu. The Reset/Diagnostics panel (Figure 7-21) is displayed.
Figure 7-21 : Reset/Diagnostics Panel
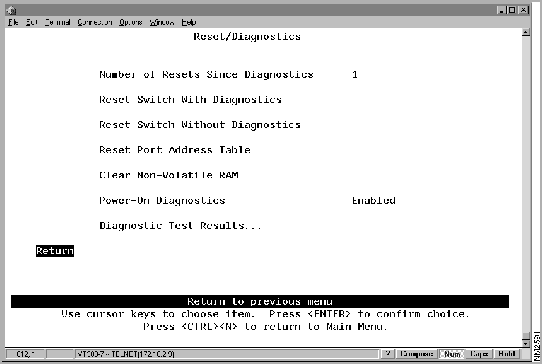
The following information is displayed on this panel:
| To | Select | Then |
|---|---|---|
| Reset the Catalyst 2600, clear all counters including address tables, and run diagnostic tests... | Reset Switch With Diagnostics | You are prompted to confirm the reset and then to press any key to initiate the reset. This does not clear any user-configured parameters. When the Catalyst 2600 restarts, parameters from NVRAM are used to initiate the operational parameters. |
| Reset the Catalyst 2600 and clear all counters including address tables without running diagnostic tests... |
Reset Switch Without Diagnostics | You are prompted to confirm the reset and then to press any key to initiate the reset. This does not clear any user-configured parameters. When the Catalyst 2600 restarts, parameters from NVRAM are used to initiate the operational parameters. |
| Clear all table entries for a selected port or all ports, set all port traffic counter to 0, and set Time since Last Reset to 0... | Reset Port Address Table | |
| Delete all user-configured parameters, such as IP address and baud rate information, and reset the Catalyst 2600... | Clear Non-volatile RAM | |
| View the results of the most recent running of power-on diagnostics... | Diagnostic Test Results | Refer to "Viewing Diagnostic Test Results". |
Viewing Diagnostic Test Results
To view the results of the most recent power-on diagnostics, select Diagnostic Test Results on the Reset/Diagnostics panel. The Diagnostic Test Results panel (Figure 7-22) is displayed.
Figure 7-22 : Diagnostic Test Results Panel
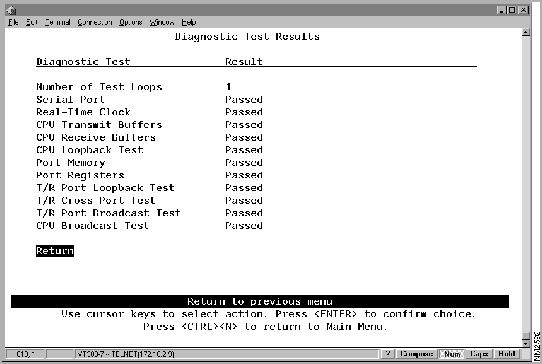
If the Catalyst 2600 is connected to a terminal via the EIA 232 port, the diagnostic messages (similar to those in Figure 7-23) should appear after you reset the Catalyst 2600 with diagnostics. An abbreviated version of these messages will appear if you reset the Catalyst 2600 without diagnostics.
Figure 7-23 : Diagnostics Messages
Catalyst 2600 Boot Firmware P/N 11152-00 RevA, Copyright 1996
- Initiating bootstrapping sequence.
- Boot image integrity check...Passed.
- Control transferred to boot process.
- Relocating main image to DRAM........Done.
- Main image integrity...succeeded.
- Control transferred to main process.
Catalyst 2600 started on Fri. January 6, 2000 12:58:0
4 Megabytes System memory
2 Megabytes Network memory
- Initialization started
- File system initialized
- System temperature is within safe operating levels
- Warmboot initialization started
- LAN ports detected:
- Token Ring Ports: 1 2 3 4 5 6 7 8 9 10 11 12 13 14 15 16
- Initializing Ports: 1 2 3 4 5 6 7 8 9 10 11 12 13 14 15 16
- Initializing system address table
- No existing diagnostic information, forcing diagnostic mode
- Starting Power Up Diagnostics test
- UART loopback test on diagnostic port...Passed
- UART loopback test on console port...Passed
- RTC memory test...Passed
- Real Time Clock test...Passed
- CPU loopback test..............Passed

- Token Ring Port loopback test...........Passed
- Token Ring Port cross port loopback test...........Passed
- Token Ring Port broadcast test...........Passed
- CPU broadcast test...Passed
- Completing Power Up Diagnostic
- Activating Ports: 1 2 3 4 5 6 7 8 9 10 11 12 13 14 15 16
- Activating IP
- Catalyst 2600 initiating bootp requests on one or more domains
- System initialization complete
Press RETURN key to activate console...
|
|
Copyright 1988-1996 © Cisco Systems Inc.