|
|

This chapter describes the CiscoWorks features that help you manage the performance level of your network, including managing individual devices, lines, and interfaces. This chapter also describes how to monitor CiscoWorks performance by:
Performance Management Applications
Several CiscoWorks applications help manage the performance of the SNMP devices in your network. A brief description of each application discussed in this chapter follows:
Use these applications to collect network data as a baseline before your network develops problems. These applications are discussed in detail in the following sections.
Creating Polling Tables Using Device Polling
This section describes how to set up a customized polling table (or table group) for devices and interfaces on the internetwork using Device Polling.

CiscoWorks allows you to probe and extract information about the condition of your networks by using the polling feature. Information acquired from these polls is stored in the database for further analysis. The construction and use of polling configurations allows you to compare relative performance and status of devices and interfaces on the network. You can poll devices individually, in groups, or poll all devices at once based on your disk space availability. Use multiple polls to collect a wide range of data at varying polling interval rates.
For consistency, this publication uses the term object as a replacement for such terms as Management Information Base (MIB) variables, MIB object instances, and so on. These terms are used interchangeably in this guide.
You must have security privileges to read and write to the Device Polling window. If you do not have write privileges, you might not be able to apply or delete table changes. You can use the Change Domain command to change to a different domain in order to access other devices for polling. You can use the Change User command to change to a username with different privileges. Use the Privilege command on the Security menu to check your privileges for Device Polling.
The polling process consists of the following general procedures. Each task is described in greater detail later in this chapter.
![]()
Figure 4-1 illustrates the device polling concept. The polling daemon CiscoWorks uses, nmpolld, queries and stores information in the Sybase database. Both the Device Polling and Polling Summary applications use the polling daemon.
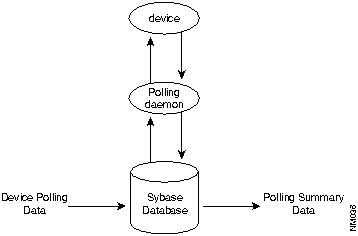
Figure 4-1 : Device Polling and Sybase Database Concept
A Device Polling table consists of the following elements: a polling frequency, a set of MIB objects, and a list of devices. The information specified in the table is collected during the polling process. A collection of information from the polling process is called a data segment. A segment is defined as the data selected from the start of polling to the stop of polling, regardless of the frequency used to sample. For instance, if you start polling at 1:00 p.m. and stop at 2:00 p.m. on the same day, the data segment will contain one hour of polling data. If you had set a polling frequency of 1 minute, you would have obtained 60 samples in the segment.
Figure 4-2 illustrates the polling table construction concept. You can select MIB objects to collect information on a device and choose a polling interval for the poll. The polling interval has a significant impact on the amount of data collected in a given time frame.
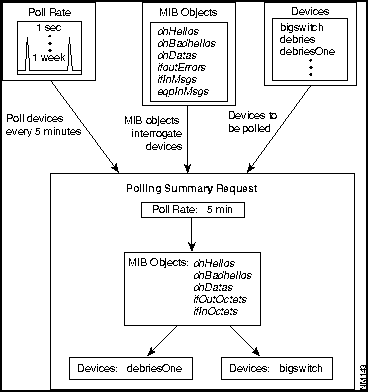
Figure 4-2 : Polling Table Construction Concept
The Polling daemon allows you to run multiple daemons. You can run any number of processes on a single system, or you can run processes on several systems.
The poller ID assigned to a polling group defines which poller process will perform the polling for that poll group. Refer to the manual page for the specific rules.
The Polling daemon on separate machines can be started or stopped by running the Process Manager on the various machines. For example, you can run the Process Manager on one workstation to start and stop a single Polling daemon and at the same time run the Process Manager on another workstation to start and stop a single Polling daemon on that machine. The Process Manager does not assist in starting or stopping more than one Polling daemon on a single machine.
Following are two caveats of starting and stopping multiple Polling daemons:
Before you can begin polling devices for data, you must set up your polling table in the Device Polling window.
Figure 4-3 illustrates the Device Polling window.
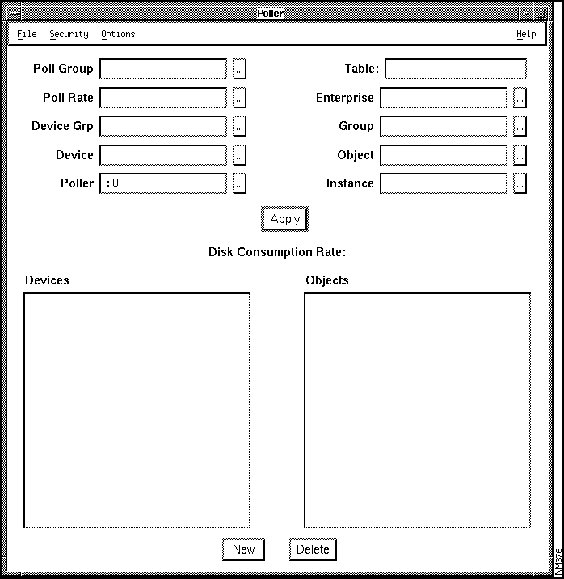
Figure 4-3 : Device Polling Window
Table 4-1 describes the components of the Device Polling window.
Table 4-1 : Device Polling Window Components
| Component | Subcomponent | Description |
|---|---|---|
| File | Print
Exit |
Prints a snapshot of the window.
Exits the current window. |
| Security | Change Domain
Change User Privilege |
Changes the domain.
Changes the user ID to another user. Views the current user ID privileges. |
| Options | Activate Changes
Destroy Table |
Sends a signal to the Polling daemon to reread the database so that current changes are included in the poll.
Deletes the selected polling table. |
| Help | On Version
On Device Polling |
Displays the CiscoWorks application version information.
Displays information about the current window. |
| Poll Group | sample
sample_load sample_traffic sample_mix sample_error |
Describes the table poll group name. For example, CiscoWorks supplies several example tables named sample*. |
| Poll Rate | Default = No polling | Sets the polling interval for the last table name selected. Polled data segments are date and timestamped with start poll times. |
| Device Grp | All Devices
Device A---Device ? Device ?---Device Z |
Lists the devices you are choosing from. |
| Device | Lists all devices currently in the device group. | |
| Poller | ;0
others Default = ;0 |
Selects which systems will actually perform the current poll.You can have multiple systems acting as polling engines.
The first poller started on every machine. |
| Table | Default is the same as the poll group name | Describes the Sybase database table name of the current poll. This name can be the same as the poll group name. |
| Enterprise | snmp-mibII
cisco hp |
Lists the enterprise MIB objects. |
| Group | (second level) | Lists of related MIB groups from the specified enterprise group above. |
| Object | (third level) | Lists of MIB object names (also referred to by Cisco as variables) from the specified MIB group above. Objects applied here define objects available in the group. |
| Instance | Pick menu for if_tables instances | Describes the list of keys supplied by the MIB object tables to poll. Only lists interfaces if you use the if_tables. Otherwise, the pick menu will be empty, and you must supply your own key for the MIB object selected. If no interface is chosen, all interfaces (keys) will be polled. Only objects in a table need or can have an instance. |
| Apply | Applies current changes for this polling table to the database. This does not notify the polling daemon. Use the Activate Changes command to complete the polling setup. | |
| Disk Consumption Rate | Describes the disk space growth rate (in kilobytes per day) to hold the data for this type of poll. | |
| New | Erases all information currently in the window. The form remains, ready to accept new information. This command does not affect data in the database. | |
| Delete | Erases the devices selected from the database. |
The Object field lists the MIB objects you can select to poll. MIB objects define the type of information about devices and interfaces that will be collected with the poll.
When selecting objects, remember the following requirements:
As each object is selected, the Disk Consumption Rate field is adjusted to reflect an estimate of how fast the disk space will be consumed in order to store the polled data. The algorithm uses the poll rate, number of devices, and number of objects currently selected in the table to estimate the space required to hold one day (24 hours) of polling. The result of the calculation is reflected as whole kilobytes required per day.
Multiply the disk space consumption rate by the length of time you plan to poll. This equals the number you compare with the available disk space. If you do not want to change the polling table, you might have to increase your database space allocation. Before deciding to adjust disk space, review the polling interval and duration and the number of objects to determine if any can be adjusted. To increase the database space, refer to Chapter 8, "Database Administration," for more information.
In order to set up polling, access the Device Polling window and complete the necessary information. If you are not familiar with MIB objects, using Device Polling will be more difficult. Contact your network administrator for more information on MIB objects.
To access the Device Polling window to set up a new polling table, perform the following steps:
If you have chosen a poll rate, the Activate Changes command informs the Polling daemon (nmpolld) to start polling this poll table.
This completes the process of creating a new polling table.
Adding Instance Data to an Existing Device and Object Pair
An instance defines which row to go to in a particular MIB table. Use the default instance selection in Device Polling to poll all objects on all devices. If you want to select specific devices and MIB objects to limit your poll group, add an instance to a device and object pair.
If you want to add an instance to a device and object pair, add the instance in the Device Polling window.
To add an instance to a device and object pair, perform the following steps:
Modifying an Existing Poll Group Table
Device polling has the following limitations:
To delete an object, delete the poll group and start again.
To modify an existing poll group table effectively, perform the following steps:
After you finish with a poll group and want to remove it from the database, delete it from the Device Polling window.
To delete a poll group, perform the following steps:
The Poll Group is now deleted from the Polling Summary table and the database.
Deleting a Device from a Poll Group
To delete a particular device from a poll group, delete the device from the Device Polling window.
To delete a device from a poll group, perform the following steps:
The device is now deleted from the poll group.
Deleting Instance Data from a Poll Group Table
If you want to delete a particular instance from a poll group, delete the instance from the Device Polling window.
To delete an instance from a poll group, perform the following steps:
The Polling Summary application enables you to perform the following tasks:
These tasks are described in the following sections.
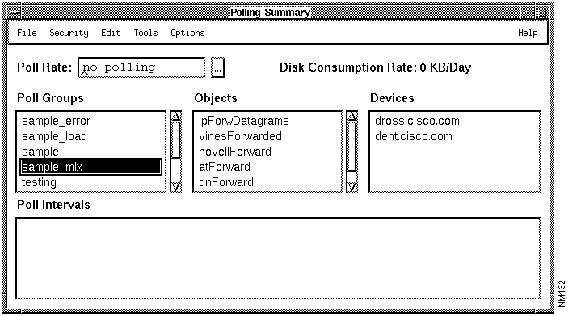
The Polling Summary window is the interface used to stop, start, browse and export poll data, and run reports.
Figure 4-4 illustrates the Polling Summary window. Table 4-2 describes its components.
Figure 4-4 : Polling Summary Window
Table 4-2 : Polling Summary Window Components
Starting or Stopping Your Poll Tables
After you set your polling criteria in the Device Polling window, you can access the Polling Summary application to turn polling off, start additional polling tables, view poll data, and so on.
To start or stop polling your poll group table, perform the following steps:
After you complete your polling activity, you can examine your data in text, graph, or report form. Data is retrieved from the polled information segments obtained in polling operations. To view polling data, you use the SNM Results Browser and Grapher on SunNet Manager or the graphers on HP OpenView or NetView for AIX. To view your polling data on the HP or NetView for AIX graphers, you will need to export the data to a spreadsheet and then import it into the grapher.
You can also run reports using the Polling Summary Tools menu. For more information on the automated SQL reports that are shipped with Polling Summary, refer to "Viewing Polling Data Using the Polling Summary Tools" later in this section.
Viewing Polling Data Using the Browser or Grapher (SunNet Manager only)
With the SunNet Manager (SNM) Results Browser and Grapher features, you can review your data report information. You can browse text information using the Results Browser. From the Results Browser, you can send data to the SNM Grapher.
For example, you can compare input broadcast packets against the total number of input packets to identify broadcast storms, as well as review and analyze interface performance or traffic patterns by observing in and out packets over specific periods.
Refer to your SNM documentation for more information on using the Results Browser and Grapher features.
To view your polling data using the browser or grapher, perform the following steps:
For more detailed information on customizing the SNM Graph Properties window, refer to your SunNet Manager 2.0 Reference Guide.
Figure 4-5 : SNM Graph Properties Window Viewing Polling Data Using the HP OpenView or NetView for AIX Graphers
The Device Polling application allows you to probe and extract data about the condition of devices on your network. In general, device polling stores data in polling tables.You can then graph the data with your platform grapher.
To view polling data using your platform grapher, complete the following steps:
Deleting Polling Data or Tables
During polling, CiscoWorks stores any poll data in segments we refer to as polling intervals. If you use polling extensively, you may need to delete polling data as a way to maintain disk space on your workstation. Instructions on how to delete selected polling intervals or entire sets of polling data follows.
The following caution applies when using CiscoWorks on any platform.
Deleting Selected Polling Data
In order to delete polling data (or intervals), perform the following steps:
In order to delete all polling data (or intervals) associated with a poll group, perform the following steps:
Viewing Polling Data Using the Polling Summary Tools
The Tools menu in the Polling Summary application contains the several utilities including an export tool and automated SQL reports. The reports.nmstool file in the $NMSROOT/lib directory contains the details of each report.
If you have an overabundance of polling data, use the $NMSROOT/etc/nmpollsummarize utility. The nmpollsummarize utility creates a summary table which summarizes data in a polling interval into averages. A poll table using a 10-second poll rate can be summarized into hourly records for a more compact file that saves on storage space. For more information on nmpollsummarize, refer to the CiscoWorks online manual page.
These automated reports help you display a variety of information including:
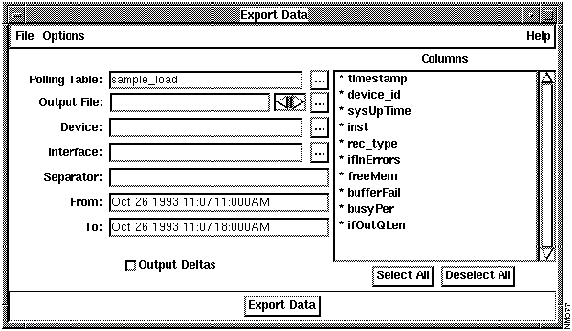
Exporting Polling Data to Flat Files
If you want to display polling data in some other format, such as a spreadsheet, the Polling Summary application offers an option that allows you to export polling data into an ASCII flat file. You can then import the ASCII file into other applications, such as a spreadsheet application, that displays your data in a more tabular format.
To export polling data to an ASCII file, perform the following steps:
Figure 4-6 : Export Data Window Table 4-3 describes the components of the Export Data window.
Table 4-3 : Export Data Window Components
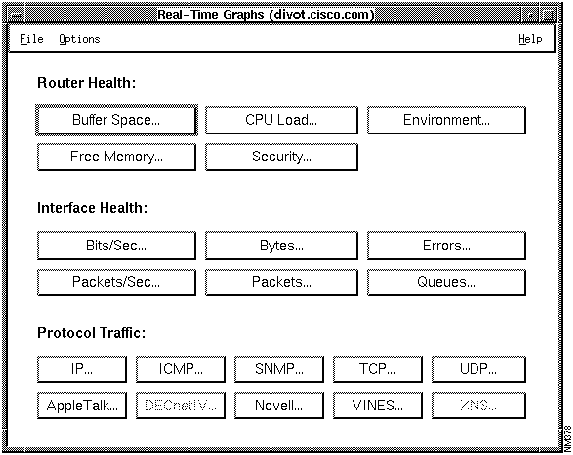
When you use the Real-Time Graphs application to manage the performance of your network, you can observe real-time information via a two- or three-dimensional graph (depending on your platform grapher). CiscoWorks enables you to graph data about router health, interface, and traffic information.
Figure 4-7 illustrates the Real-Time Graphs window.
Figure 4-7 : Real-Time Graphs Window
Table 4-4 describes the components of the Real-Time Graphs window.
Table 4-4 : Real-Time Graphs Window Components
Graphing Your Real-Time Device Data
The Real-Time Graphs application observes the behavior of devices suspected of being in degraded mode or introducing erratic behavior in traffic patterns, error status indications, or statistics.
To create a graph with real-time device data, perform the following steps:
On SNM, you can customize your current graph. For instructions, refer to your SunNet Manager 2.0 User's Guide. The Grapher is an SNM feature and is not covered in this publication. On HP OpenView or NetView for AIX you can customize your graph using their platform grapher. Refer to your NMS documentation for more information.
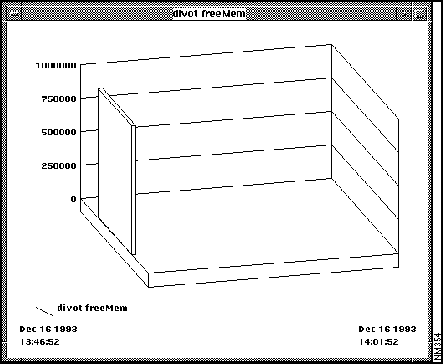
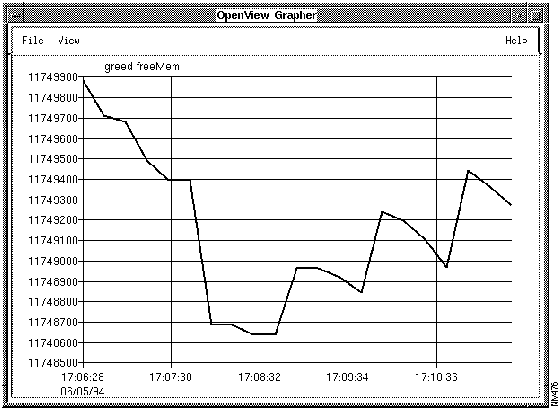
Figure 4-8 : Real-Time Grapher Window for Buffer Space Statistics on SunNet Manager
Figure 4-9 : Real-Time Grapher Window for Free Memory on HP OpenView
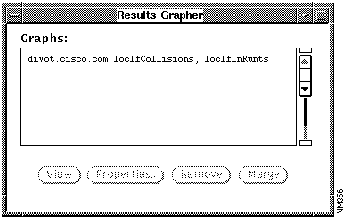
Figure 4-10 : Results Grapher Window on SunNet Manager
Viewing or Changing Graph Properties (SunNet Manager only)
If you want to change the appearance of your real-time graph or delete the graph, use the SNM Results Grapher window. The following tasks can be performed using the SNM Results Grapher:
For more information on the SNM grapher, refer to the SunNet Manager 2.0 User's Guide.
Table 4-5, Table 4-6, and Table 4-7 describe the command buttons in the Real-Time Graphs window. (See Figure 4-7.)
Table 4-5 : Router Health Buttons
Table 4-6 : Interface Health Buttons
Table 4-7 : Protocol Traffic Buttons
The Path Tool application enables you to monitor the performance our severity thresholds over a period of time and monitor the changes accordingly so you can collect baseline data. This application is described in the section "Locating Device Routing Paths" in Chapter 3, "Fault Management."
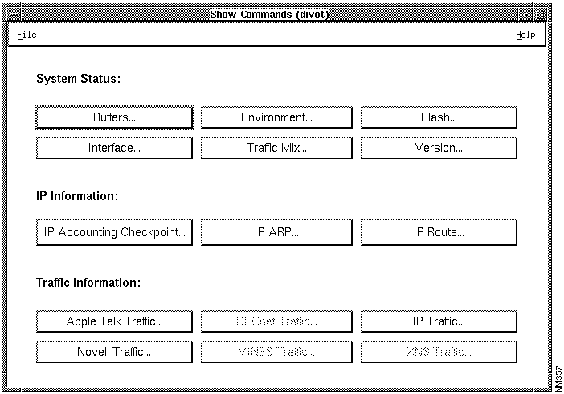
Using Show Commands to View Router Data
You can use the Show Commands application to monitor system status, IP information, and traffic information. This information helps you to determine how to change and improve the efficiency of your network environment.
For more detailed descriptions of all show commands, refer to the Router Products Configuration and Reference publication refer to Volume 1 for all but protocol-specific show traffic commands and show commands.
For detailed information on the Show Command window components, refer to "Using Show Commands to View Router Data," in Chapter 3, "Fault Management."
To use the Show Commands application, perform the following steps:
Figure 4-11 : Show Commands Window Loading Private MIBs on HP OpenView or NetView for AIX
With CiscoWorks on HP OpenView or NetView for AIX, you can load a private MIB into the menu bar. To accomplish this, you need to place the MIB file onto the network management platform, then load the MIB file into CiscoWorks.
By default, the Cisco MIB is loaded after you install CiscoWorks. To load a private MIB into HP OpenView or NetView for AIX and CiscoWorks, perform the follow steps:
Writing Reports with the Sybase Data Workbench (DWB)
The CiscoWorks Sybase DWB application allows you to access the Sybase Data Workbench (DWB) utilities. While Sybase DWB provides several applications, this section only describes how to use the report-writing application in DWB. For more information on Sybase DWB, refer to the Sybase documentation.
There are several ways to access Sybase DWB: through the SNM Tools menu, through the Misc menu, or through the command line. These methods for accessing Sybase DWB are described in the following sections.
For complete information on the Sybase DWB applications, refer to the Sybase manuals listed in the section "About This Guide." For an online manual page, enter syman dwb. Sybase contains a documentation directory that has several helpful files called $SYBASE/doc.
Invoking Sybase DWB from the Menu
To invoke the Sybase DWB application, perform the following steps:
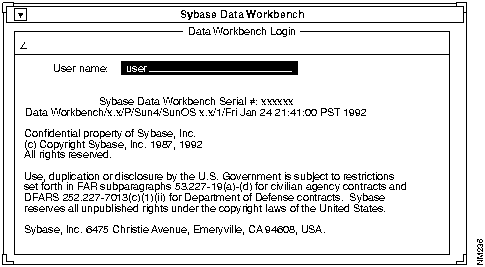
Figure 4-12 : Sybase Data Workbench Login Window
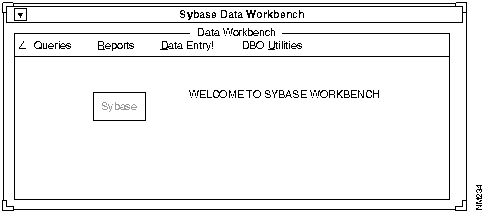
Figure 4-13 : Sybase Data Workbench Invoking Sybase DWB from the Command Line
Before running this application from the command line, alter your terminal environment variable. We recommend that you access the application through the menu because it alters the variable automatically. If you need to use the command line, follow these steps:
The Reports menu on the Sybase Data Workbench window enables you to run and print a report on any table created with the Device Polling application.
Following are two examples of how to use the report-writing feature:
Running a Sample Report with VQL
This section describes how to run sample reports that are available in the CiscoWorks database.
There are three sample reports in the CiscoWorks database: devices, totals, and utilization. These reports correlate to the Sybase polling tables named sample*.
A brief description of the sample reports follow:
To run the sample reports, perform the following steps:
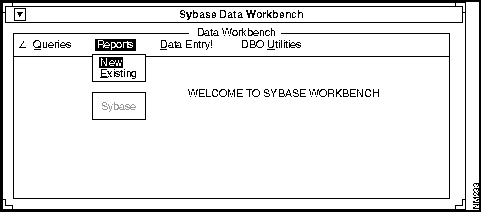
Figure 4-14 : Sybase Data Workbench---Reports Menu
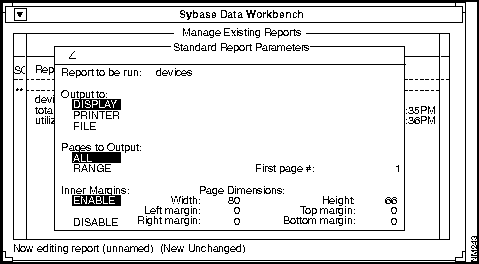
Figure 4-15 : Sybase Data Workbench---Standard Report Parameters Window
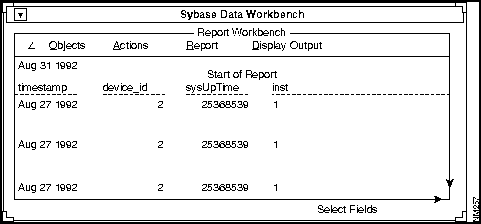
Figure 4-16 : Sybase Data Workbench---Standard Report Creating a New Report with VQL
This section describes how to create a new report. To create a new report, define the report you want to run and then format it using the Device Polling and Polling Summary applications. In a custom polling table, the columns containing the polled object values are labeled var[1-n], where n is the number of polled MIB objects. The genmibview script in the $NMSROOT/etc directory enables you to create a view of the polling table that substitutes MIB object names for current column names such as var1 and var2. Use the genmibview script on polling tables prior to CiscoWorks 2.0. Tables created with CiscoWorks 2.0 contain MIB object names for current columns automatically.
The following examples use the default VQL layout. For details on how to customize the format of your reports, refer to the Sybase Data Workbench User's Guide
To create a new report, complete the following steps:
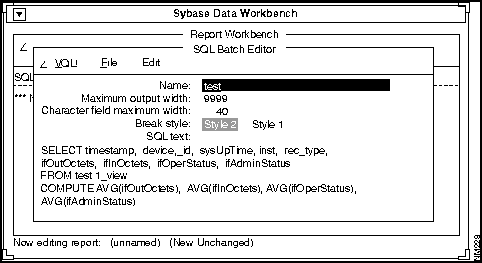
Figure 4-17 : SQL Batch Editor Window
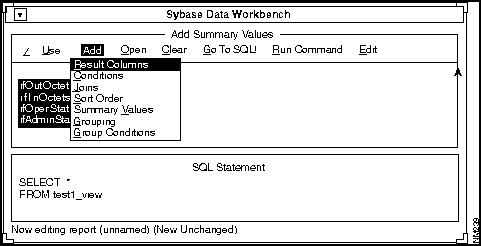
Figure 4-18 : Sybase Data Workbench---Results Columns Command
![]()
![]()
If you are not using if_tables, you must know the format of Sun MIB object tables found in the schema file to enter the instance values. If you do not know the format, skip the Instance field. This will cause the poll group to poll all instances. Only objects in a table need or can have an instance. You can skip this field if your object does not belong to an object table.
![]()

Component
Subcomponent
Description
File
Print
Exit
Prints a snapshot of the window.
Exits the current window.
Security
Change Domain
Change User
Privileges
Changes your domain.
Changes your user ID to another user.
Views the current user ID privileges.
Edit
Delete Poll Interval
Delete All Data
Deletes the selected poll interval.
Deletes all data in the selected poll group.
Tools
Allows you to run reports and export poll data to a file. You can also add custom commands. Menu items include:
Export Data
Configuration Summary Report
Device Inventory Report
Errors by Device Report
Device Load Report
Top/Bottom 10 IF Traffic Report (Gross)
Top/Bottom 10 IF Traffic Report (Normalized)
Traffic by Interface Report
Traffic Mix Report
Help for Reports
Schedule Polling
Options
Activate Changes
Browse Data
(for SNM only)
Destroy Table
Signals the device polling daemon to reread the database to get polling changes.
Uses SNM Browser to view selected data reports or to graph data using Grapher.
Deletes the selected polling group.
Help
On Version
On Polling Summary
Displays the CiscoWorks version information for this application.
Displays a manual page on the current window.
Poll Rate
no polling
1, 2, 5, 10, 30 seconds
1, 2, 5, 10, 30 minutes
1, 2, 5, 12 hours
1, 2, 14 days
1 week
Starts and stops the polling process. Sets the polling time interval for the last table name selected. Any change is reflected in the database.
Disk Consumption Rate
Describes the disk growth rate required (in kilobytes per day) to hold the data for this type of poll.
Poll Groups scroller
Lists the poll groups available with the Device Polling window. These are also known as tables.
Objects scroller
Lists MIB objects defined in Device Polling.
Devices scroller
Lists all devices in the poll group defined in Device Polling. You may need to use Sync w/Sybase to locate new devices.
Poll Intervals scroller
Lists data reports that contain poll report data. Includes the start time and length of poll interval for the data report.
![]()

![]()
![]()
Component
Subcomponent
Description
File
Print
Exit
Prints a snapshot of the window.
Exits the current window.
Options
Toggle Buttons:
Export Poll Table
Export Summary Table
To UNIX File
To Sybase File
Allows you to select which export method to use:
The summary tables are created using the nmpollsummarize command.
Table Pick Menu
Polling or Summary
Contains the polling or summary table name which contains the data. Allows you to change to a poll or summary table from the pick menu.
Output File
Pick Menu
Allows you to name the file which will contain the exported data.
Device
Pick Menu
Restricts output to a specific device in the poll group. Enter the name of the device without the domain name or click on the pick menu.
Interface
Pick Menu
Restricts output to a specific interface of a device. To use this field you must also name a device in the Device field. Enter the interface index (ifIndex) value of the interface or click on the pick menu.
Separator
Allows you to enter any character to replace the default Tab character that separates fields.
From
Restricts output to be later than a specified date/time. Enter the date and time in the following format: Jan 1 1994 1:00AM
To
Restricts output to be earlier than a specified date/time. Enter the date and time in the following format: Jan 1 1994 1:00AM
Output Deltas toggle button
Causes counter and timetick values to be exported as delta values rather than absolute values.
Columns list
Displays the columns in the poll table named in the Table field. An asterisk (*) to the left of the column name indicates that this column will be included in the output file. Clicking on an entry in the Columns listbox toggles asterisk on and off.
Select All
Returns all asterisks in the Columns list to on.
Deselect All
Turns all asterisks in the Columns list off. Turning the asterisks off prevents the column from being included in the output file.
Export Data
Turns all asterisks in the Columns list back on. Turning the asterisks off prevents the column from being included in the output file.

Component
Subcomponent
Description
File
Print
Exit
Prints a snapshot of the window.
Exits the current window.
Option
Set Polling
Frequency
Changes polling rate. Frequency of analysis performance is represented in seconds. Can be set using slider or entering in the polling interval field. Default = 2 seconds.
Help
On Version
On Real-Time Graphs
Displays the CiscoWorks application version information.
Displays a manual page on the current window.
Router Health
Interface Health
Protocol Traffic1
Refer to Table 4-5 for detailed descriptions of the router health buttons.
Refer to Table 4-6 for detailed descriptions of the interface health buttons.
Refer to Table 4-7 for detailed descriptions of the protocol traffic buttons.
1 If a button is grayed out, the selected device does not have this capability. For example, currently only Cisco AGS+ and Cisco 7000 with Microcode Version 2.0 have the Environment router health button capability.
![]()
Buttons
Description
MIB Object Names
Buffer Space
Displays the following buffer elements: number of free buffers, maximum number, hits, misses, creates, buffer allocation failures, and buffer create failures due to no free memory.
bufferElFree
bufferElMax
bufferElHit
bufferElMiss
bufferElCreate
bufferFail
bufferNoMem
CPU Load
Displays CPU busy percentage for one- and five-minute averages and for the last five-second period.
avgBusy1
avgBusy5
busyPer
Environment
Displays AGS+ router internal temperature and airflow statistics.
envInternalTemperature (envTestPt1Measure)
envAirflowTemperature (envTestPt2Measure)
Free Memory
Displays the amount of free memory in bytes.
freeMem
Security
Displays the total number of packets dropped due to access control failures.
ipNoaccess
For DECnet, dnNoaccess
For AppleTalk, atNoaccess
Buttons
Description
MIB Object Names
Bits/Sec
Displays the 5-minute average of input and output bits per second for Cisco-specific devices.
locIfInBitsSec
locIfOutBitsSec
Bytes
Displays the 5-minute average of input and output bits per second. For routers with Software Release 9.1, displays all protocols on an interface.
ifInOctets
ifOutOctets
Errors
For Cisco-specific devices, displays number of input packets with various characteristics.
For Ethernet, 802.3 CSMA/CD, and starLAN:
locIfCollisions
locIfInRunts
locIfInGiants
locIfInCRC
locIfResets
locIfRestarts
For FDDI and Token Ring:
locIfInRunts
locIfInGiants
locIfInCRC
locIfResets
locIfRestarts
For serial (Cisco only):
locIfInFrame
locIfInOverrun
locIfInIgnored
locIfInAbort
locIfResets
locIfRestarts
locIfCarTrans
For any non-Cisco devices, displays number of input and output errors with various characteristics on an interface.
ifInErrors
ifOutErrors
Packets/Sec
Displays the 5-minute average of input and output packets per second on an interface.
locIfInPktsSec
locIfOutPktsSec
Packets
For any device, displays the input and output packets on an interface. For routers with Software Release 9.1, displays all protocols on an interface.
ifInNUcastPkts
ifOutNUcastPkts
ifInUcastPkts
ifOutUcastPkts
Queue
For any Cisco-specific device, displays the number of packets dropped because the input or output queue was full.
locIfInputQueueDrops
locIfOutputQueueDrops
ifOutQLen (non-Cisco devices)
Button
Description
MIB Object Names
AppleTalk
Displays cumulative AppleTalk packet activity.
atInput
atOutput
atForward
atLocal
atBcastin
atBcastout
atNoencap
atInmult
IP
Displays cumulative IP packet activity.
ipForwDatagrams
ipInDelivers
ipInReceives
ipOutRequests
ipInDiscards
ipOutDiscards
ipOutNoRoutes
ICMP
Displays cumulative ICMP activity.
icmpInMsgs
icmpOutMsgs
icmpInErrors
icmpOutErrors
icmpInEchos
icmpOutEchos
icmpInEchoReps
icmpOutEchoReps
SNMP
Displays cumulative SNMP packet activity.
snmpInTotalReqVars
snmpInTotalSetVars
snmpInTraps
snmpOutTraps
snmpInPkts
snmpOutPkts
snmpOutGetResponses
snmpOutSetRequests
TCP
Displays cumulative TCP packet activity.
tcpActiveOpens
tcpPassiveOpens
tcpAttemptFails
tcpEstabResets
tcpInSegs
tcpOutSegs
tcpRetransSegs
UDP
Displays cumulative UDP packet activity.
udpInDatagrams
udpOutDatagrams
udpInErrors
udpNoPorts
DECnet IV
Displays cumulative DECnet IV packet activity.
dnForward
dnReceived
dnHellos
dnHellosent
dnDatas
dnNoroute
dnToomanyhops
Novell
Displays cumulative Novell packet activity.
novellInput
novellOutput
novellForward
novellLocal
novellBcastin
novellBcastout
novellNoroute
novellNoencap
VINES
Displays cumulative VINES packet activity.
vinesInput
vinesOutput
vinesForwarded
vinesLocaldest
vinesBcastin
vinesBcastout
vinesBcastfwd
vinesNoroute
vinesEncapsfailed
XNS
Displays cumulative XNS packet activity.
xnsInput
xnsForward
xnsLocal
xnsBcastin
xnsBcastout
xnsErrin
xnsErrout


/usr/OV/snmp_mibs.
%
echo $TERM
set term=xterm_c.sun
set term=xterm_c.hp
set term=xterm
%
cd $NMSROOT/sybase/bin
%
dwb
%
set term=original term setting
hostname%
printenv SYBASE
%
cd $NMSROOT/etc
%
genmibview -U
user
-P
password tablename